The XRP chart shared by popular analyst Egrag Crypto is sparking major attention and for good reason. According to his long-term analysis, Ripple price could be on the verge of a massive breakout. If history repeats itself, XRP may soon enter what Egrag calls the “KABOOM Phase,” with price targets that could leave today’s $2 level in the dust.
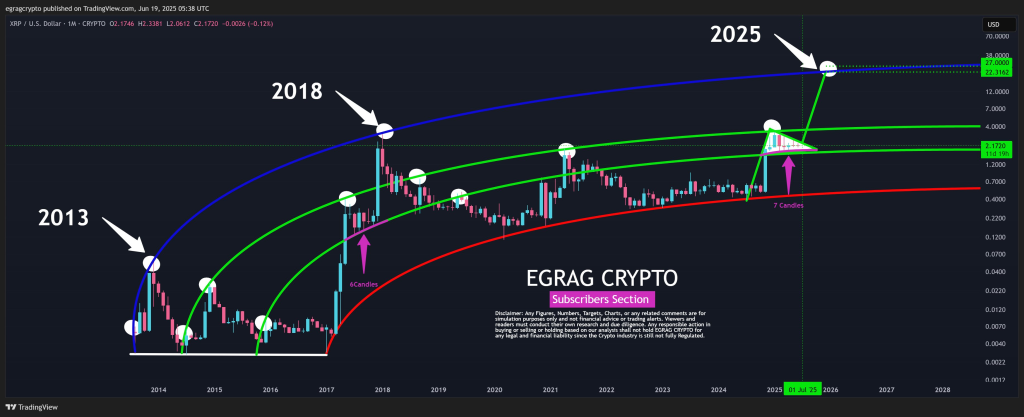
The chart uses what Egrag refers to as the RGB Arch model, made up of red, green, and blue curved trend lines. These arches seem to capture the historical price movements of XRP from as far back as 2013. In both 2013 and 2018, XRP followed a very similar pattern. Price moved upward in waves, consolidated for a few candles, then exploded dramatically, touching the upper blue arc both times.
Now, in 2025, Egrag believes the same pattern is setting up again.
What you'll learn 👉
XRP Has Completed the Candle Setup for a Big Move
Egrag points out that in 2017, it took just six monthly candles for XRP to finish consolidating before launching into a parabolic run. This time, XRP has already spent seven candles in consolidation, forming a triangle just below the upper green arc. That triangle has now reached its tip, and the price is hovering at $2.17.
According to Egrag, that seventh candle is the final preparation before XRP enters its most explosive move yet. “There’s still room for one more candle,” he says, “but after that, get ready for the ‘KABOOM Phase.’”
Price Targets Reach as High as $27 and $38
So, how high could XRP go if this breakout really happens?
Egrag’s chart outlines two clear targets. The first major resistance zone sits just above the $22 mark, where the upper green band intersects. If XRP smashes through that, the next target lies at the upper blue arc between $27 and $38.
These levels aren’t just random guesses. They’re based on XRP’s historical behavior within the same curved structure. Both the 2013 and 2018 rallies ended around this upper blue boundary. If momentum mirrors past cycles, Egrag’s $27 to $38 forecast could be more than just speculation.
July 2025 Could Be the Tipping Point
At the bottom of the chart, there’s a clear marker: July 1, 2025. That’s the key date Egrag has identified where the current triangle formation should resolve. From his perspective, it doesn’t matter whether XRP breaks upward or downward. What matters is that the move will likely be explosive either way.
Still, as Egrag himself says, he remains a “permabull” on Ripple. He believes the structure is primed to guide XRP toward his target zones, and he’s calling on the XRP community to “stay steady and strong.”
Read Also: Why Kaspa Whales Are Quietly Loading Up on KAS During the Dip
$38 Is Possible Long-Term
This chart from Egrag Crypto paints a bullish picture for Ripple. If XRP continues to follow its historical arc-based trajectory, then the current $2 range could just be the beginning. With targets pointing toward $27 and even $38, traders and long-term holders will want to watch closely as July approaches.
Whether or not the “KABOOM Phase” truly kicks off, one thing is clear, the XRP price action could be about to get very interesting.
Subscribe to our YouTube channel for daily crypto updates, market insights, and expert analysis.