XRP remains locked in a sideways trading range between $2.10 and $2.30, this includes several weeks of fading momentum.
With no strong breakout catalysts, XRP price action continues to show weakness, and most technical indicators stay in bearish territory.
The token attempted a recovery earlier this week but failed to clear key resistance near $2.22. As of now, XRP is hovering near $2.16, with no clear signal that buyers are regaining control.
Let’s take a closer look at today’s setup.
What you'll learn 👉
📅 What We Got Right Yesterday
In yesterday’s prediction, we emphasized that XRP needed to hold the $2.10 support to avoid a deeper slide, while warning that upside would be capped below the $2.30–$2.33 zone unless strong volume came in.
That outlook held true. XRP faced rejection near the 9-day SMA at $2.21 and quickly dropped back below $2.17. Sellers stepped in again, and the market remained stuck in a narrow range, lacking bullish momentum.
We also highlighted that a break below $2.10 could send the price toward $2.00. That support is now being tested more frequently, and will increase pressure on bulls to defend it.
📊 XRP Daily Overview (June 18)
- Current Price: $2.1618
- 24h Change: -3.40%
- Daily RSI (14): 39.08
- Volume: Flat, no trend reversal
XRP price is still stuck below its key moving averages and hasn’t managed to get back above the 20-day SMA since May. It’s also trading under the 50, 100, and 200-day levels, which just shows how much ground the bulls need to make up. The rejection at the short-term moving average shows buyers are still struggling.
🔍 What the XRP Chart Is Showing
The chart structure remains bearish. A clear lower high has formed, and sellers have defended the $2.22–$2.25 zone repeatedly.
The most recent candle is a bearish engulfing pattern with a long upper wick, which displays strong rejection. The $2.10 support is still holding for now, but the more it gets tested, the weaker it looks.
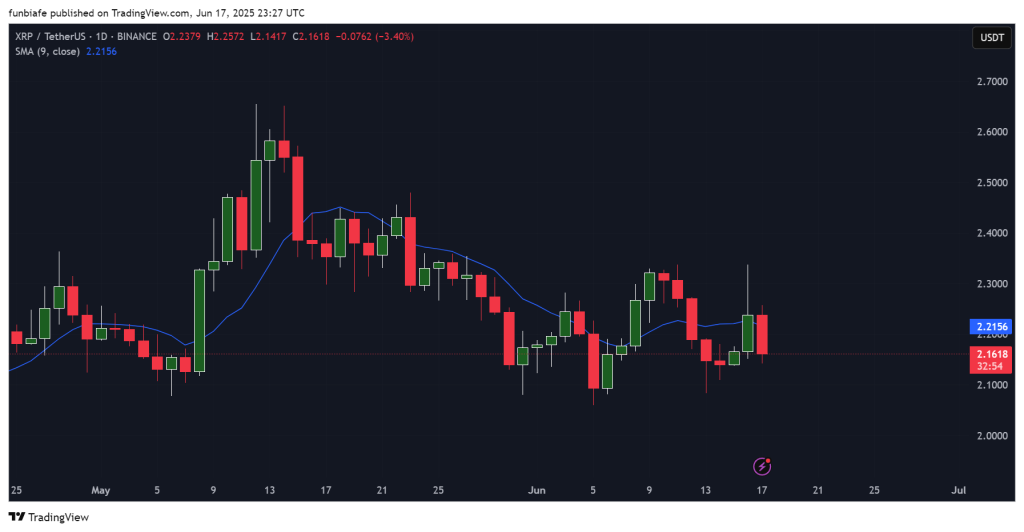
If XRP breaks clearly below that level, it could be heading toward $2.00. Momentum’s still weak, and the daily swings are getting smaller.
Read Also: Here’s XRP Price If Ripple Fully Integrates Circle USDC With RLUSD
📈 Technical Indicators (Daily Timeframe)
| Indicator | Value | Signal/Interpretation |
| MACD (12,26) | -0.019 | Bearish crossover, downward pressure continues |
| RSI (14) | 39.077 | Weak momentum, still in bearish territory |
| CCI (14) | -92.1712 | Strong selling, near oversold |
| Ultimate Oscillator | 40.249 | Bearish tone, fading buying pressure |
| Stochastic | 28.533 | Short-term bounce attempt, no confirmation |
| ATR (14) | 0.0235 | Low volatility, tight range trading |
Summary: Most indicators are still leaning bearish. RSI, CCI, MACD, and the Ultimate Oscillator all show downward pressure. The Stochastic shows a possible bounce, but the setup lacks volume and confirmation
🔮 XRP Price Prediction Scenarios
Bullish Scenario:
If XRP can close above $2.33 with some real volume behind it, it could send XRP toward $2.50 or $2.65. But for that to happen, buyers need to take out key resistance and break through the descending trendline first.
Neutral Scenario:
If $2.10 holds up, XRP price will continue to range between $2.10 and $2.30. Don’t expect much movement today unless volume kicks in.
Bearish Scenario:
If XRP dips under $2.10, it could quickly slide back to $2.00, especially if more sellers step in. That would pretty much confirm the downtrend still going.
🧠 Wrapping Up
XRP price remains range-bound with bearish bias. The $2.10 level is a key zone to watch today. Unless buyers return with volume and break resistance at $2.30, price action is likely to stay choppy and reactive.
Subscribe to our YouTube channel for daily crypto updates, market insights, and expert analysis.