
XRP is showing signs of early bullish momentum today after bouncing from recent lows. At writing, the token trades at $2.38, posting a 2.45% daily gain, though overall trading volume has dipped slightly by 1.17%. After a strong rally earlier this month and a correction that followed, XRP price now finds itself in a consolidation phase, and the market is watching closely to see if the bulls are ready to push again.
The price remains under the 50-period SMA on the 4-hour chart, currently around $2.44, acting as resistance. Multiple indicators on the hourly chart are flashing Buy, hinting that another move could be building, but buyers must reclaim $2.45 to shift the near-term trend.
What you'll learn 👉
What the XRP Chart Is Showing
The 4H chart shows XRP price had a solid rally from May 7 to May 13, jumping from below $2.10 to a high of $2.65. That move was followed by a steep correction, which sent the price back below the 50 SMA. Since May 18, XRP has been trying to form a base around the $2.30–$2.38 zone, signaling potential for a reversal or more sideways movement.
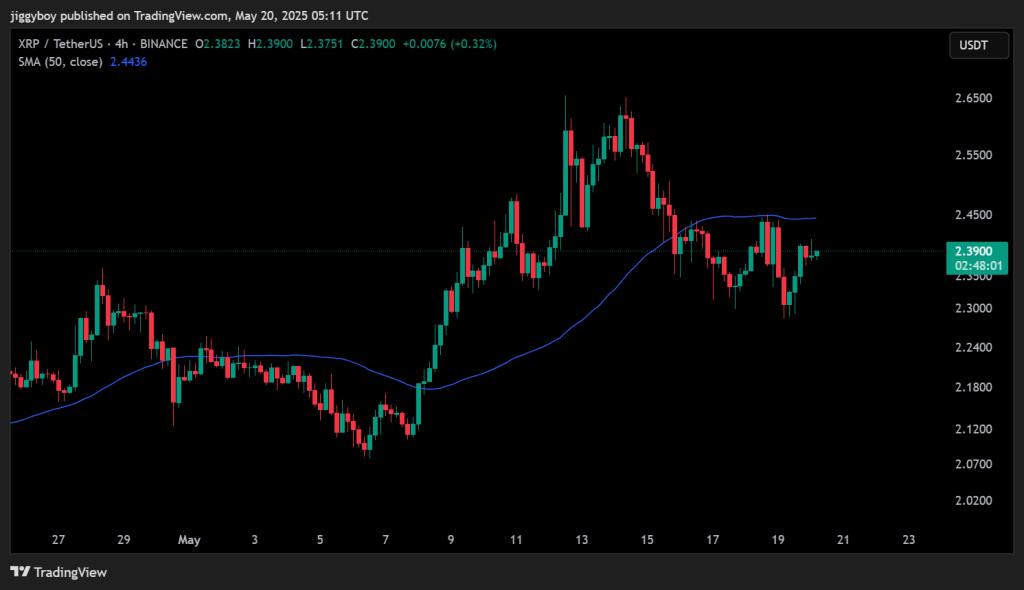
Price is now hovering just below that SMA resistance at $2.44–$2.45. A confirmed breakout above it could signal bullish continuation. However, failure to hold the $2.30 support area could open the door for a retest of $2.18–$2.20, which was the previous breakout zone.
Technical Indicators (Hourly Timeframe)
| Indicator | Value | Interpretation |
| RSI (14) | 56.45 | Neutral to bullish, room to move higher |
| MACD (12,26) | 0.005 | Bullish crossover, early trend formation |
| CCI (14) | 73.05 | Positive momentum, not overbought |
| Ultimate Oscillator | 52.72 | Mild bullish pressure |
| ROC (Rate of Change) | 1.678 | Steady upward pace |
| Bull/Bear Power (13) | 0.0195 | Buyers slightly in control |
Read Also: Pi Network Community Divided: Transparency Battle Between Influencers Heats Up
Indicator Analysis (Textual)
RSI at 56.45 is still below the overbought level, suggesting buyers have more room to work with before any major reversal risk. The MACD shows a small but meaningful bullish crossover, typically a sign that momentum is shifting upward. CCI confirms this with a reading in positive territory, but not yet overheated.
The Ultimate Oscillator remains just above 50, indicating a light bullish bias. Meanwhile, the ROC shows XRP price is picking up speed, while Bull/Bear Power signals a slight buyer advantage, though not aggressive.
XRP Price Forecast for Today (May 20)
1. Pessimistic Case
- Target: $2.18 – $2.30
- If XRP price fails to hold the current zone and selling pressure increases, price could slide back toward the $2.18 support. That would suggest a continuation of the current short-term downtrend.
2. Realistic Case
- Target: $2.38 – $2.45
- Most likely scenario is sideways trading just under the 50 SMA. Technical indicators support a slow buildup of buying interest, but the price needs more volume to break out.
3. Optimistic Case
- Target: $2.55 – $2.65
- If XRP price reclaims the 50 SMA and closes above $2.45, momentum could return quickly. This would likely trigger a rally back toward previous highs from May 13.
Subscribe to our YouTube channel for daily crypto updates, market insights, and expert analysis.

We recommend eToro
Wide range of assets: cryptocurrencies alongside other investment products such as stocks and ETFs.
Copy trading: allows users to copy the trades of leading traders, for free.
User-friendly: eToro’s web-based platform and mobile app are user-friendly and easy to navigate.