
Stellar (XLM) looks like it’s finally waking up. After weeks of sideways movement and declining volatility, the XLM price is starting to push higher. Right now, it’s sitting just above the $0.29 mark, which happens to be a major technical zone. Traders are watching closely because this level is acting like a pivot point. A breakout here could set the stage for a much bigger rally.
The current chart formation is hard to ignore. It clearly resembles an inverse head and shoulders, one of the most well-known reversal patterns in technical analysis. This setup forms when sellers run out of steam and buyers begin stepping in more aggressively. That’s exactly what seems to be playing out on the XLM price chart.
What you'll learn 👉
XLM Price Breaks Neckline as Reversal Takes Shape
According to chart analysis shared by Ali, known as @ali_charts on X, Stellar has formed a classic inverse head and shoulders pattern. The left shoulder showed up in March, followed by a deeper dip in early April, which became the head. More recently, the right shoulder formed with a higher low, hinting that selling pressure was weakening. The neckline of this pattern, which connects the peaks between the shoulders, sits around $0.29.
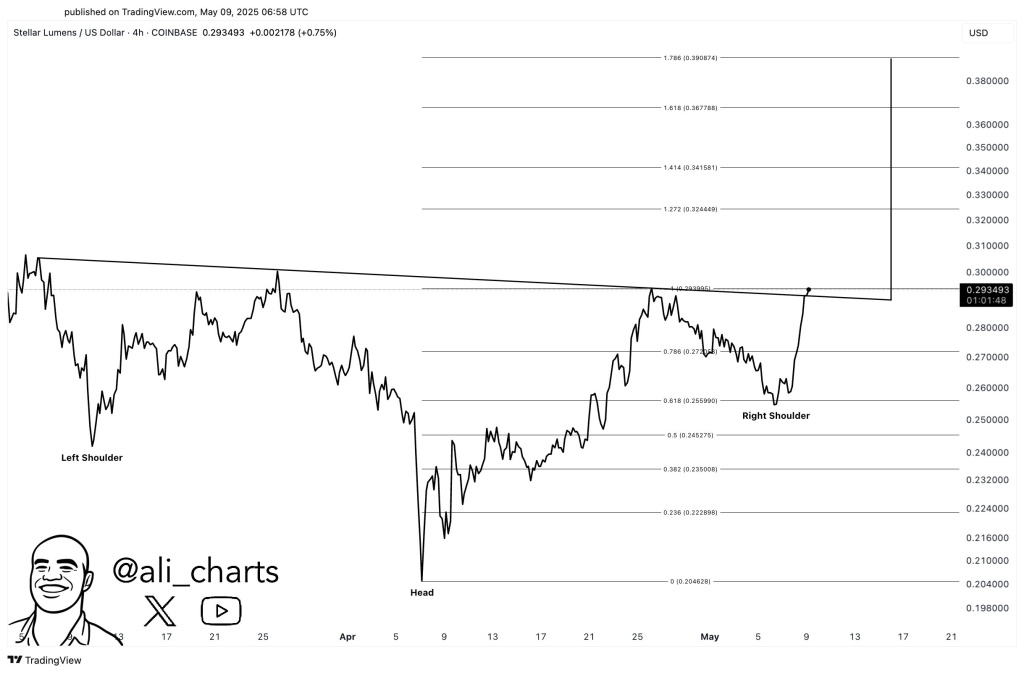
As of now, the Stellar price has edged just above that line and is trading at approximately $0.293. That breakout, if confirmed with a strong daily close, could be the beginning of a bullish leg higher. Ali’s chart suggests that this breakout isn’t just a small bump but could trigger a sustained rally if momentum builds.
Stellar Price Targets: What Comes Next for XLM?
Ali’s chart goes a step further by outlining key Fibonacci extension levels. These are commonly used by traders to project how far a breakout might run. The first major level comes in at $0.324. If the XLM price can clear that, the next zones to watch are around $0.34 and $0.357. In the most optimistic scenario, the rally could extend toward $0.37, which aligns with the 1.786 Fibonacci extension.
Read Also: We Asked AI to Predict Stellar (XLM) Price for May
Of course, these targets assume that the current breakout holds and isn’t just a fakeout. Still, the pattern itself is solid and suggests a clear shift in structure. With the broader market showing strength and meme coins and altcoins alike catching bids, XLM could easily ride that momentum.
As Ali noted in his tweet, “#Stellar $XLM is breaking out!” And based on what we’re seeing on the chart, he might be onto something big.
Subscribe to our YouTube channel for daily crypto updates, market insights, and expert analysis.

We recommend eToro
Wide range of assets: cryptocurrencies alongside other investment products such as stocks and ETFs.
Copy trading: allows users to copy the trades of leading traders, for free.
User-friendly: eToro’s web-based platform and mobile app are user-friendly and easy to navigate.