A week that will likely be completely forgotten in the crypto history books, as prices barely moved in the past few days. XRP is no exception as the price gained 2.5% this week, but trading sideways, now at $2.06.
With this in mind, let’s take a look at where could the XRP price be headed today and this weekend.
What you'll learn 👉
XRP Chart Analysis
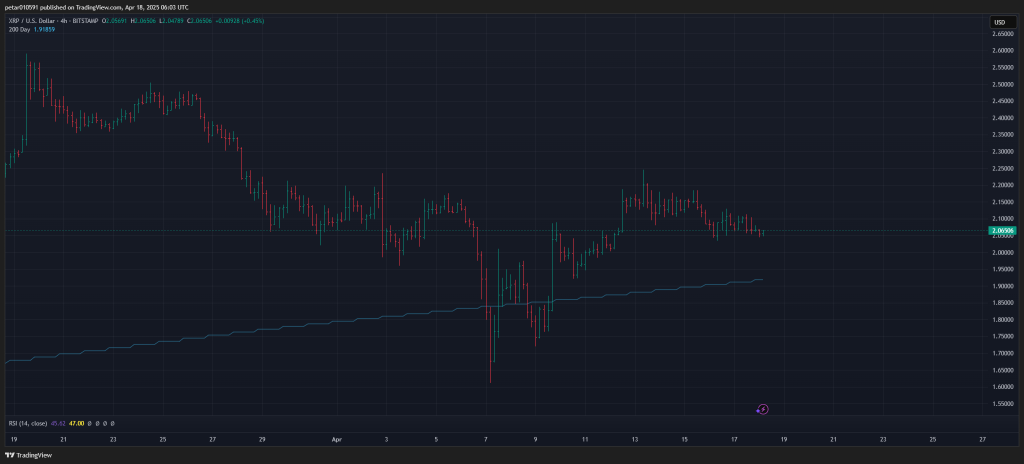
XRP is trading at $2.065 right now. It’s been moving sideways since bouncing back from its April 7 low. The price is stuck between the $2.15 resistance above and the 200-day moving average ($1.918) below. Earlier this month, XRP tried to break above $2.20 but failed, which is why we’re seeing this sideways movement.
The short-term trend doesn’t show a clear direction. While XRP stays above the 200-day moving average (a good sign for long-term holders), the momentum is fading as the price moves flat.

Important support levels to watch are $2.00, which is a key psychological level, the 200-day moving average at $1.92, and $1.80 if the other supports break. On the upside, XRP needs to break through $2.15-$2.20 to continue moving up. If it manages to do that, the next target would be around $2.35.
What Technical Indicators Show
The technical indicators for XRP show mixed signals. The Commodity Channel Index (CCI) sits just above zero at 16.68, meaning the market is neither overbought nor oversold. This fits with what we see on the chart – XRP moving sideways around $2.05-$2.10.
The Ultimate Oscillator reads 46.59, which is below the middle point of 50. This suggests weakening momentum. The Rate of Change is negative at -3.00, and the MACD is also slightly negative. These signs tell us that buyers are having trouble taking control of the market. The Bull/Bear Power reading is also slightly negative, showing that sellers have a small edge right now.
| Indicator | Value | Explanation |
|---|---|---|
| CCI (14) | 16.6843 | Slightly positive but near neutral; suggests indecision, not strong momentum. |
| Ultimate Oscillator | 46.591 | Below the 50 level, pointing to weak bullish pressure. |
| ROC (Rate of Change) | -3.002 | Negative value indicates momentum is fading and trend may reverse. |
| Bull/Bear Power | -0.0448 | Slight bearish pressure; bears currently have a small upper hand. |
| MACD (12,26) | -0.041 | MACD line is below the signal line; a bearish signal for short-term trend. |
Weekend XRP Price Predictions
If things go well and XRP holds above $2.00 and breaks through $2.15, we could see the XRP price reach $2.20 quickly. With enough buying volume, it might even push toward $2.35 by Sunday. For this to happen, we’d need some good news – perhaps something positive about the Ripple-SEC case or a general rise in altcoin prices.
On the other hand, if XRP drops below $2.00 or falls under the 200-day moving average at $1.92, we could see it pull back to $1.92 first. More selling could push it down to $1.80 over the weekend. This could happen if the weak momentum continues, if the whole crypto market drops, or if there’s bad news that hit crypto all of a sudden.
Based on the current situation, XRP will likely continue moving sideways within its current range for the immediate future.
Read also: ONDO or Ripple (XRP): In Which Should You Invest $10,000
Subscribe to our YouTube channel for daily crypto updates, market insights, and expert analysis.
We recommend eToro
Wide range of assets: cryptocurrencies alongside other investment products such as stocks and ETFs.
Copy trading: allows users to copy the trades of leading traders, for free.
User-friendly: eToro’s web-based platform and mobile app are user-friendly and easy to navigate.


