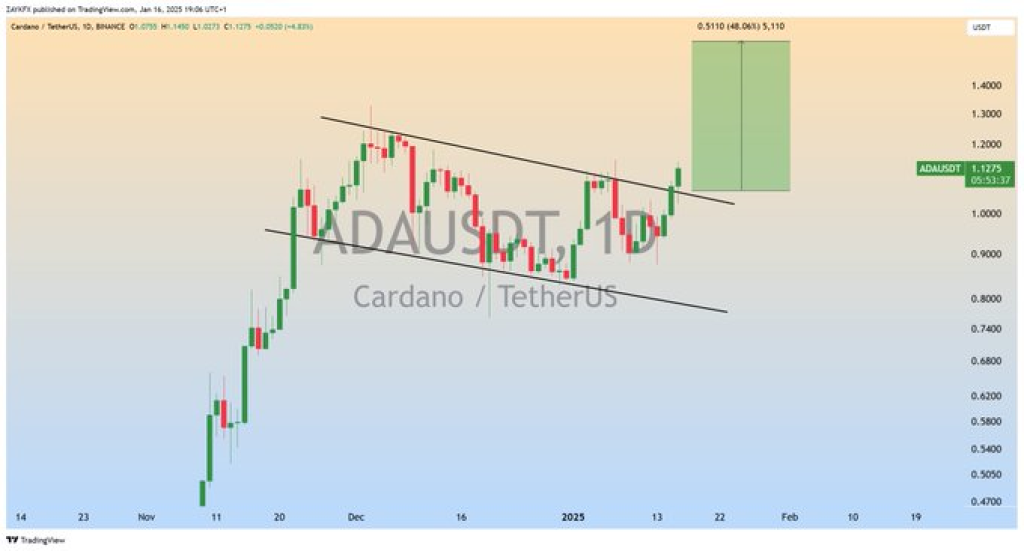
Crypto analyst ZAYKCharts revealed something interesting with Cardano’s price pattern on X after it just broke above the $1 resistance level. He noted that the pattern looks like it could mean prices are heading up soon. Looking at ADA’s daily chart, we can see it’s finally broken out after trading sideways for a while. This breakout suggests Cardano could be headed for an upward move.
What you'll learn 👉
ADA Chart Analysis: Breakout from the Descending Channel
Cardano’s price had been stuck in a downward pattern for months. Through the second half of 2024, the price kept making lower peaks and dips, showing that sellers were in control.
But things changed in early January 2025. The price pushed through its usual ceiling, breaking free from that months-long downward trend. This kind of move often means the trend is flipping from negative to positive.
ZAYKCharts pointed out that the breakout was significant in confirming the upward potential for ADA. This break in the pattern suggests Cardano’s price might keep climbing. Since it pushed past that price level that was holding it back, there’s a good chance it could keep moving up from here.
Support and Resistance Zones for ADA
The current price of ADA has bounced off the lower trendline of the descending channel, which previously acted as a support zone. Given the breakout, this level is now expected to shift higher, possibly forming a new support level in the process. The price is likely to maintain this support as it moves higher, helping to solidify the bullish trend.
On the upside, ADA’s price faces resistance at higher levels, with the first significant target in the range of $1.30–$1.40. The chart analysis suggests that a price level of $1.51 is a key resistance point to watch. Should the price continue to climb, ADA might reach these levels, depending on whether the breakout is sustained and the support zones hold.
Read Also: Litecoin (LTC) Price Movement Signals Possible Uptrend – Analyst Explains Why
Bullish Flag Pattern and Analyst Expectations
The bullish flag pattern identified by ZAYKCharts has played a key role in the prediction of a bullish wave for Cardano. A bullish flag typically follows a sharp upward movement, followed by a period of consolidation, as seen in the recent chart of ADA.
The breakout above the flag’s upper boundary signals the potential for the continuation of the initial price surge. ZAYKCharts confirmed their expectation of a bullish wave based on this technical pattern, which aligns with the chart’s movements.
ADA’s chart, combined with the tweet from ZAYKCharts, offers insight into the analyst’s outlook for the cryptocurrency. As the market reacts to these signals, ADA’s price performance in the coming weeks will depend on whether the bullish flag pattern holds and if ADA can maintain momentum above the breakout point.
Subscribe to our YouTube channel for daily crypto updates, market insights, and expert analysis.

We recommend eToro
Wide range of assets: cryptocurrencies alongside other investment products such as stocks and ETFs.
Copy trading: allows users to copy the trades of leading traders, for free.
User-friendly: eToro’s web-based platform and mobile app are user-friendly and easy to navigate.