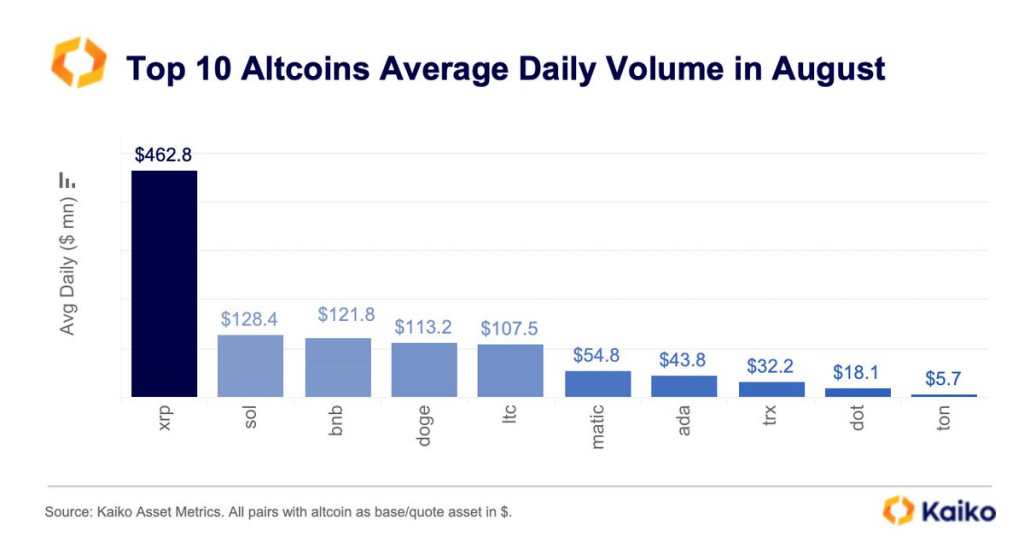
The cryptocurrency market analyst Kaiko, known for their insightful Twitter commentary, pointed out today that despite its recent pullback, XRP has shown stronger trading activity compared to other altcoins in August.
According to Kaiko, XRP’s average trade volume was $462 million last month, which is four times higher than the next largest altcoins by trade volume.

What you'll learn 👉
What Stronger Trading Activity Means for an Altcoin
Stronger trading activity in an altcoin like XRP signifies a high level of investor interest and market liquidity. This can be beneficial for several reasons:
- Price Discovery: A higher trading volume allows for more efficient price discovery, meaning the market price more accurately reflects the asset’s true value.
- Reduced Volatility: Higher liquidity can often lead to reduced price volatility, making the asset more stable.
- Investor Confidence: Strong trading activity often attracts more investors, potentially driving the price higher.
- Market Influence: An altcoin with high trading volume can have a significant impact on market trends, often setting the pace for other altcoins.
Technical Analysis of XRP Price
A closer examination of the daily chart for XRP reveals a series of ups and downs that have left investors on edge. The cryptocurrency recently experienced a significant drop in price, falling below the crucial 100-day moving average at $0.55 and reaching the 200-day moving average at $0.5.
This downward movement disrupted what had been a bullish trend, resulting in a rejection at these key levels, reports CryptoSanders9563 on TradingView.
Interestingly, a sudden rebound occurred, pushing the price back above the 200-day moving average. This upward movement was largely attributed to Grayscale’s legal victory over the SEC, which seemed to inject a dose of optimism into the market. However, this optimism was short-lived, as the price once again faced rejection, leading to another dip below the significant moving average. This particular area serves as a substantial support zone, and if it holds, it could potentially halt further declines in the asset’s value.

When it comes to momentum indicators, the picture is mixed. On one hand, the MACD line is above the MACD Signal Line, which is generally considered a bullish sign. On the other hand, the RSI is below 45, indicating a bearish sentiment among traders. This divergence in indicators suggests that the market is somewhat uncertain about the asset’s future direction.
As for support and resistance levels, the nearest support zone for XRP is at $0.45. On the upside, the asset faces resistance at $0.55, which previously acted as a support level. Further resistance zones are located at $0.68 and $0.92. In light of these factors, the 200-day moving average stands as a critical point to watch. A breakdown below this level, followed by a subsequent pullback, could be a harbinger of a medium to long-term bearish trend for XRP.
In summary, while XRP’s strong trading activity indicates a high level of market interest, its technical indicators present a more nuanced picture. Investors and traders should closely monitor these key metrics and levels to better understand where the asset might be headed next.
We recommend eToro
Wide range of assets: cryptocurrencies alongside other investment products such as stocks and ETFs.
Copy trading: allows users to copy the trades of leading traders, for free.
User-friendly: eToro’s web-based platform and mobile app are user-friendly and easy to navigate.


