
A sudden price surge often feels like a sign of strength, yet sharp vertical climbs sometimes hide weak foundations. ZEC price sits right in that confusing zone today. The move toward a potential Zcash ETF has created excitement, although the chart shared by Crypto Patel paints a very different picture.
A simple glance at the resistance near $782 already shows why traders are watching this level closely, and the fear of a deeper drop is not coming from thin air.
What you'll learn 👉
ZEC Price Is Still Facing A Major Wall Despite ETF Momentum
ZEC rallied far beyond what many expected this year, and the conversation around a possible Zcash ETF added even more fuel. Grayscale submitted an S3 filing as an attempt to convert its Zcash Trust, known as ZCSH, into a regulated structure holding actual ZEC. The plan mirrors the design of spot Bitcoin and Ethereum ETFs where shares track the underlying coins. This created hope for stronger liquidity and better accessibility for traditional investors.
Crypto Patel highlighted that the trust has operated without a standard redemption program since 2017. The proposed ETF aims to solve that structural weakness. The trust currently manages tens of millions of dollars in net assets with several million shares outstanding. These details often spark speculation about a shift toward more stability. The temptation is to assume ZEC will only rise from here. The chart suggests otherwise.
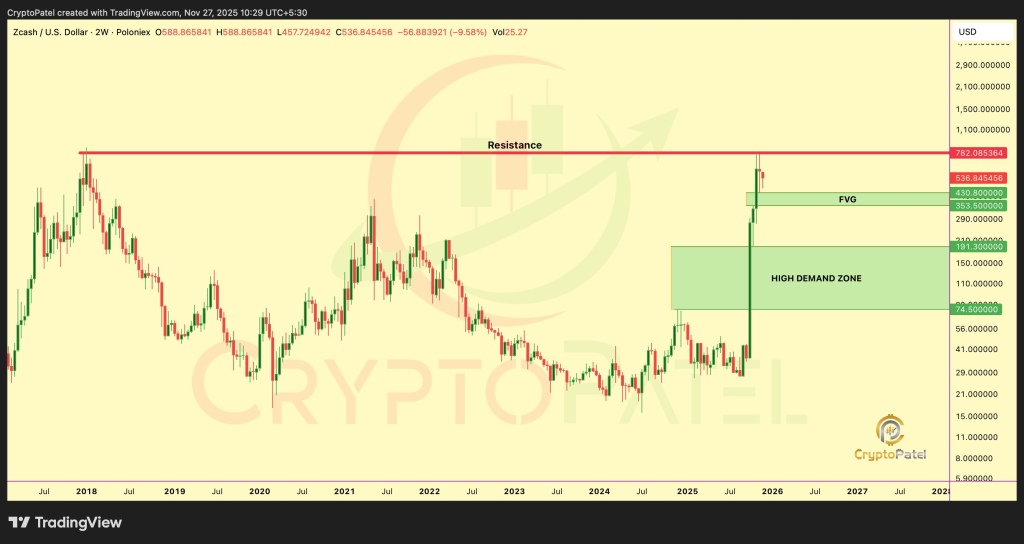
The resistance at $782 acted as a ceiling years ago and still behaves that way. ZEC tapped that level again and immediately lost momentum. Many traders find this area significant because the price previously reversed from this exact region during multiple market cycles. Crypto Patel pointed out that staying below $700 leaves room for a large correction toward $200 or even $100. The hard rejection around that historical barrier supports this view.
ZEC Technical Structure Shows A Clear Gap That Could Pull Price Lower
Charts can reveal emotional behaviour long before the news cycle catches up. ZEC formed a massive Fair Value Gap around the $430 to $353 region. This type of imbalance often works like a magnet that pulls the price down during heavy volatility. The candle that launched ZEC toward its recent peak left this zone untouched, and large gaps have a habit of being revisited.
Below the FVG sits a wide, high-demand zone stretching from roughly $191 to $74. The market spent years consolidating inside that region. Many analysts, including Crypto Patel, treat this zone as the area where long-term players usually reaccumulate during deep corrections. The distance from the recent $700 to this demand block is steep, yet ZEC has travelled that road before.
The long-term chart includes several periods where rapid spikes were followed by equally rapid collapses. The current pattern looks similar to the early bursts seen in some fast-moving chains during previous cycles. A few traders compare it to the excitement around SOL in its early days, when each vertical push eventually retraced to fill liquidity gaps. ZEC shows comparable behavior today.
ZEC ETF Filing Does Not Guarantee Immediate Strength
Grayscale’s filing is a proposal rather than a confirmed product. The SEC must still evaluate the S3 submission. A successful conversion would transform ZCSH into an ETF structure holding real ZEC rather than simply representing trust shares. The concept sounds promising, although the path is not guaranteed.
The trust has operated over the counter for years and was designed for accredited investors with no standard redemption program. The switch to an ETF could solve that limitation if the SEC approves it. Crypto Patel emphasized that filings do not always lead to immediate market support. Traders tend to overestimate the short-term effect of regulatory milestones. This creates a disconnect between sentiment and structure.
ZEC’s chart shows that the market responded more to technical levels than to the filing announcement. The resistance held firm even during peak excitement. Price action still controls the narrative, no matter how appealing the ETF story sounds.
Read Also: Top Analyst Says Bitcoin (BTC) Price Struggles Will Drag On for Years: Here’s Why
ZEC Price Reaction Near Resistance Suggests A Possible Sharp Reversal
The two-week chart shows a strong wick rejection at the $782 resistance. Rejections at this scale usually represent heavy selling pressure. The momentum candle that pushed ZEC upward appears unsustainable when viewed against the long-term history. A climb of over 2,700 percent in a single year signals extreme volatility rather than stable growth.
Crypto Patel’s analysis points to a possible return toward the high demand zone. A fall to $200 or even $100 may seem dramatic, although the technical structure supports the possibility. The chart shows two clear regions where liquidity sits. The first is the FVG. The second is the high demand block. Price tends to revisit these zones when momentum fades.
The pattern echoes previous cycles where ZEC rallied, stagnated near resistance, and retraced heavily. This happened multiple times since 2017. The current setup resembles those earlier corrections closely. The ETF news may create long-term optimism, yet the near-term chart still supports the idea of a pullback.

We recommend eToro
Wide range of assets: cryptocurrencies alongside other investment products such as stocks and ETFs.
Copy trading: allows users to copy the trades of leading traders, for free.
User-friendly: eToro’s web-based platform and mobile app are user-friendly and easy to navigate.