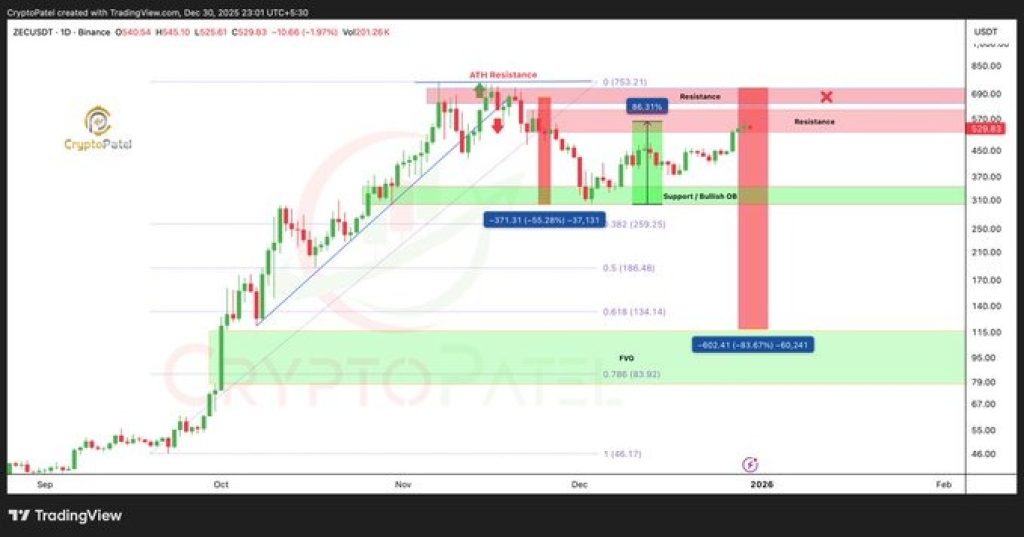
The Zcash (ZEC) price has had a wild few months. After topping out in the $700–$750 zone, ZEC sold off hard and lost roughly half its value, sliding all the way down to the $300 area. That drop marked the end of a fast and emotional rally, but it also set up the move that followed.
From that $300 low, ZEC bounced sharply. Price pushed back toward $500 and briefly traded in the $500–$550 range, delivering an 80%+ rebound for anyone who caught the move early. On the surface, that looks strong. But when you zoom out, the chart tells a more cautious story.
What you'll learn 👉
What the ZEC Chart Is Showing
The recent bounce fits cleanly inside a larger corrective structure. The ZEC price rallied straight into a heavy resistance zone between $550 and $600, an area that has already rejected price multiple times.
This zone lines up with prior distribution and failed breakouts, which makes it a natural place for sellers to step back in.
The chart also shows that the move from $300 to $550 happened quickly, with little consolidation along the way. Rallies like that often attract late buyers near the top, especially after a big percentage gain. That’s where risk increases fast.
Above this zone, the next key level is around $720. A strong higher-timeframe close above that level would invalidate the bearish setup. Until that happens, price remains capped below major resistance.
Why the $300 Bounce Doesn’t Mean Safety For ZEC Price
It’s important to separate a bounce from a trend change. ZEC bouncing off $300 doesn’t automatically mean the worst is over. In fact, sharp rebounds are common in downtrends, especially after large drops.
The chart structure shows there is still room for price to move lower later on. If the Zcash price fails to hold above the mid-range and loses momentum near resistance, a deeper move becomes more likely.
The next major downside area sits below $200, where long-term support and prior accumulation zones start to appear.
That doesn’t mean price collapses immediately. It means the risk-to-reward for new longs above $500 is poor compared to earlier entries near $300.
Read Also: Solana’s Validator Collapse Exposes a Harsh Truth About SOL’s Economics
Key Levels Traders Are Watching For Zcash
Right now, the market is focused on a few clear levels. The $550–$600 area acts as a decision zone. Holding below it keeps pressure on the downside. A clean break and hold above $720 would change the picture and force bears to step aside.
On the downside, $300 remains the first major support. If that level fails on a future retest, the chart opens up toward the sub-$200 region, where the next meaningful base could form.
Moreover, the ZEC price has already delivered the easy part of the move. The bounce from $300 to $550 rewarded patience and discipline. From here, the trade gets harder.
Chasing longs at these levels carries high risk, while the chart still allows for a much deeper pullback later. Until ZEC proves it can reclaim and hold above major resistance, the warning signs remain firmly in place.
Subscribe to our YouTube channel for daily crypto updates, market insights, and expert analysis.