Ripple’s XRP has been a topic of intense discussion among investors and analysts alike. The current market trends suggest a potential upswing for XRP, with key indicators pointing towards a promising future for this digital asset.
In the recent past, XRP has shown a steady upward trajectory, with expectations of reaching at least 51 cents in the short term. The market dynamics indicate that XRP is on its way to achieving this target, following a consistent wave count.
Doge2014 raises 500K in days celebrating Dogecoin. Make potentially big profits and get in on exclusive airdrop!
Show more +The current market analysis suggests a potential turn to the downside in the region between 51 cents and 54 cents. This resistance area has been a topic of discussion over the past few days, with the anticipation of a smaller Wave 2. The idea is that the low made on the 16th of June is moving up in a WXY structure, where each wave consists of an ABC pattern.
The first signal of this upward trend was observed when XRP left the support area to the upside and broke above the wave W high at 49.7 cents. Although it didn’t break and sustain, it still signaled that we are in the Y wave.
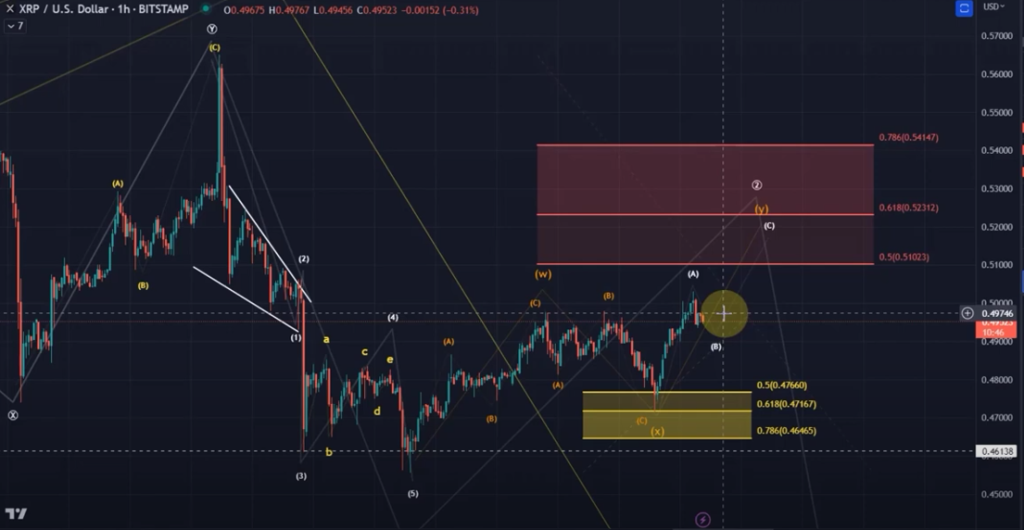
However, it’s important to note that B waves can be very flexible. They can be short or long, and at the moment, it’s believed that this might only be a bit of a pullback, and that we may see a C wave later of Wave Y of wave 2.
In terms of potential targets, the relevant standard Fibonacci resistances for Wave 2 indicate an area between 51 cents and 54.1 cents, with the 52.3 Cent level in between the golden ratio. The length of the wave W, measured from the low of the X wave, suggests that the first likely target for the Y wave is at 51.2 cents.
However, it’s crucial to understand that there’s never a guarantee that the price will turn down from here. The local trend is up, and the short-term trend is up as well. The next decision area will be how the price reacts to the 51 cents mark.
The real pivot point is that ideally, Wave 2 does not get above the 54.1 Cent level or at least doesn’t break and sustain above it. If it does, it will most likely lead to invalidation of this trend or count to the downside and would unlock prices first to 56.6 cents and then 58.6.
In conclusion, while the XRP count is a little less reliable because it is moving in three waves all the time, the current market trends suggest a potential upswing for this digital asset. However, investors should be aware of sudden pullbacks and headwinds that just happen on the XRP chart. For now, the count is being followed, and the relevant pivot point is 54.1 cents. Above that level, it might very well be that we are resetting this B wave higher into the 70th Cent region.
The Bullish Breakout of Pepe Coin (PEPE)
The winds of change are blowing for Pepe Coin (PEPE). After a period of bearish trends, the coin is showing signs of a bullish divergence. This shift is not just a mere fluctuation but a significant change in the market dynamics.
A keen eye will notice that PEPEUSDT has broken through a falling trendline. This break is not to be taken lightly. In the realm of technical analysis, such a break often signals the beginning of a bullish setup. The evidence lies in the charts.
But what does this mean for investors and traders? It’s simple. The bearish trend that had been dominating the PEPE market is losing its grip. A bullish divergence is forming, indicating a potential upward trend. This could be an opportune moment for those looking to enter the market or increase their holdings.
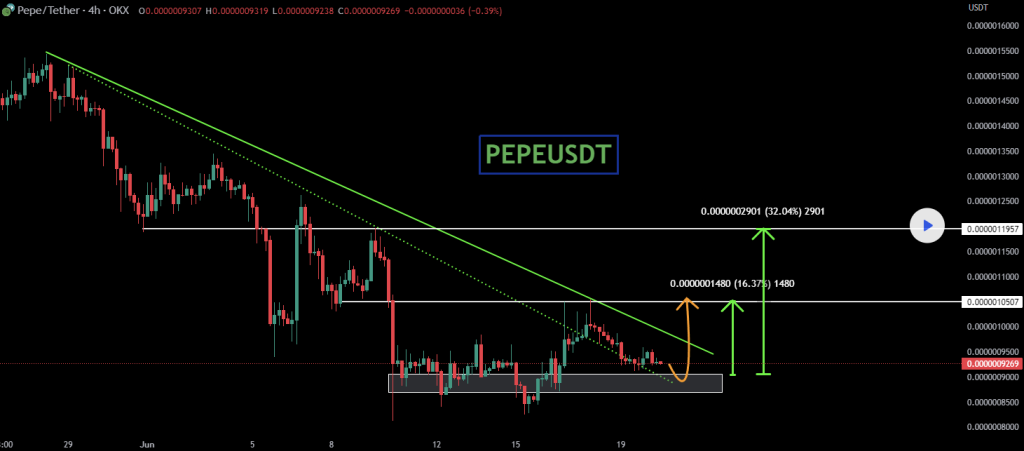
Source: TradingView
Delving deeper into the technical aspects of the chart, it’s clear that the bullish divergence is a key point of interest. This divergence is a pattern that can signal a potential reversal of the current bearish trend. It occurs when the price of PEPE is making new lows while the momentum is starting to gain strength – a discrepancy that often precedes a change in trend.
The breaking of the falling trendline is another significant event to note. In technical analysis, a trendline is a line drawn over pivot highs or under pivot lows to show the prevailing direction of price. Trendlines are a visual representation of support and resistance in any time frame. The breaking of such a line is a strong signal that the previous downward trend is losing steam and a new upward trend might be on the horizon.
However, as with all investments, caution is advised. While the charts show promising signs, the world of cryptocurrency is known for its volatility. It’s crucial to stay informed and make decisions based on a comprehensive understanding of the market.