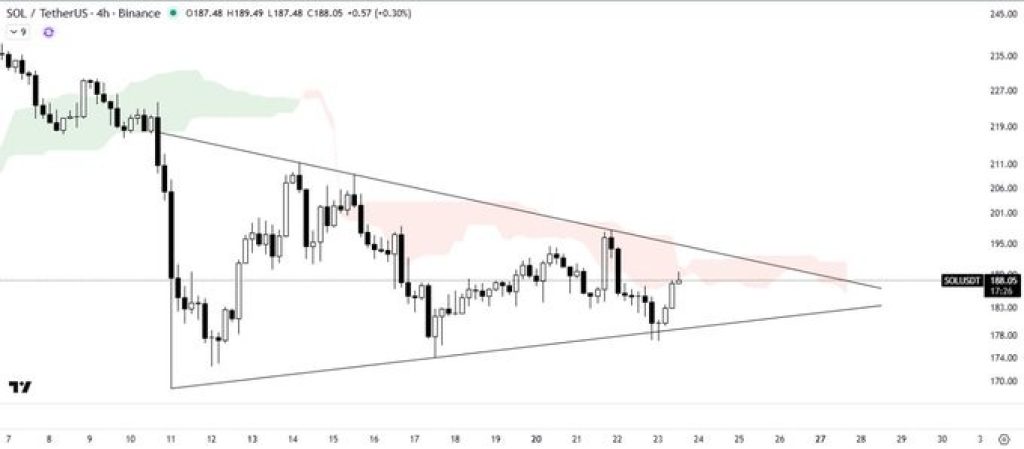
Solana looks like it’s gearing up for something big. After a choppy few weeks, the SOL price is back near $188, sitting right inside a tightening symmetrical triangle pattern.
Every move is getting smaller, every bounce sharper, and when a chart compresses like this, it usually means a big breakout is coming soon.
According to The Crypto Express, Solana just bounced off the lower trendline of that triangle, showing buyers are still defending the zone around $180.
The only thing standing in the way right now is the Ichimoku Cloud, which sits right above current levels. A clean break through that cloud, and out of the triangle, could mark the start of Solana’s next strong leg upward.
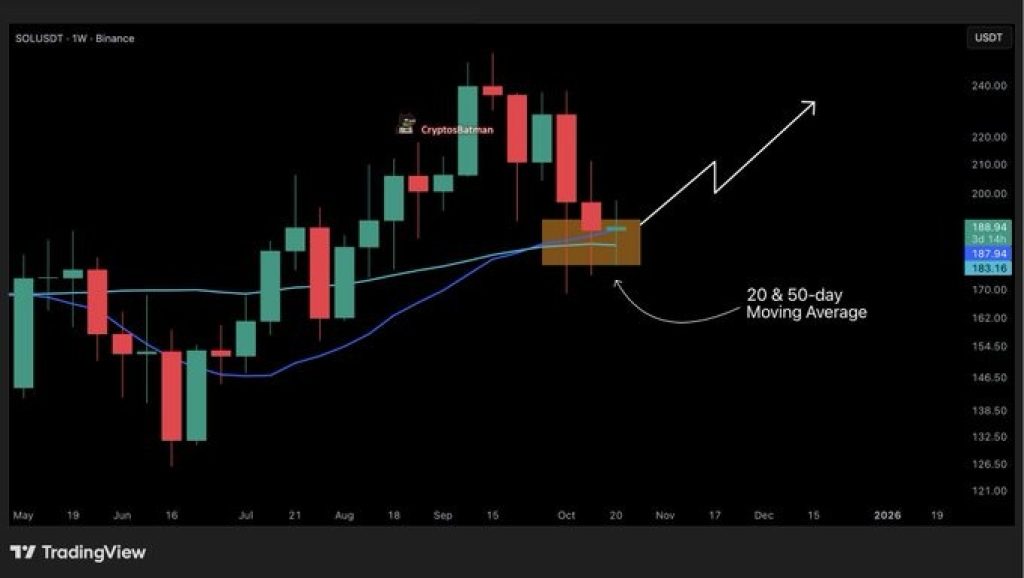
At the same time, Crypto Batman highlighted something that adds even more confidence to this setup: on the weekly chart, Solana price is sitting exactly at the 20-day and 50-day moving average confluence.
That’s a technical support area that’s held firm multiple times in the past and often triggers strong reversals when the broader market turns positive.
Read Also: ASTER Downtrend Fading: Why a 2x Recovery Could Be Next
What the SOL Chart Is Telling Us
The 4-hour chart clearly shows Solana coiling inside a symmetrical triangle. This pattern usually acts like a spring, the longer it tightens, the stronger the eventual move.
Right now, bulls are keeping higher lows intact while sellers are slowly losing control. Volume has also started to tick up slightly, which is often an early hint that momentum is shifting.
If Solana price is able to close above $195 with some follow-through, that would confirm a bullish breakout. Then further targets come into place around $210 and $225, both significant resistance levels from early October.
On the flip side, if price rejects again at the top of the pattern, a short dip to retest $175 wouldn’t be surprising before any real breakout happens.
Moreover, momentum indicators are starting to tilt bullish. The RSI is rising from neutral territory, and the MACD is on the verge of flipping positive again. Add to that the double support from the 20-day and 50-day moving averages, and Solana’s setup looks solid from a technical standpoint.
The Ichimoku Cloud, now pink for most of the month of October, is in the process of narrowing, suggesting resistance at levels above $190 won’t last long. Once price breaches through it, the momentum might continue very fast, especially if Bitcoin sustains its stability.
SOL Price Short-Term Outlook
All eyes are now on this narrowing range. Solana price has been trading in compression for almost two weeks, and it’s reaching the point where the pattern will have to resolve.
If bulls manage to break the $195–$200 zone with volume, the move could extend toward $220 faster than most expect.
For now, patience is key, but the SOL chart is clearly hinting that a major spike might just be days away. With strong confluence support below and the cloud thinning above, Solana’s next breakout could set the tone for how the rest of Q4 plays out.
Subscribe to our YouTube channel for daily crypto updates, market insights, and expert analysis.