
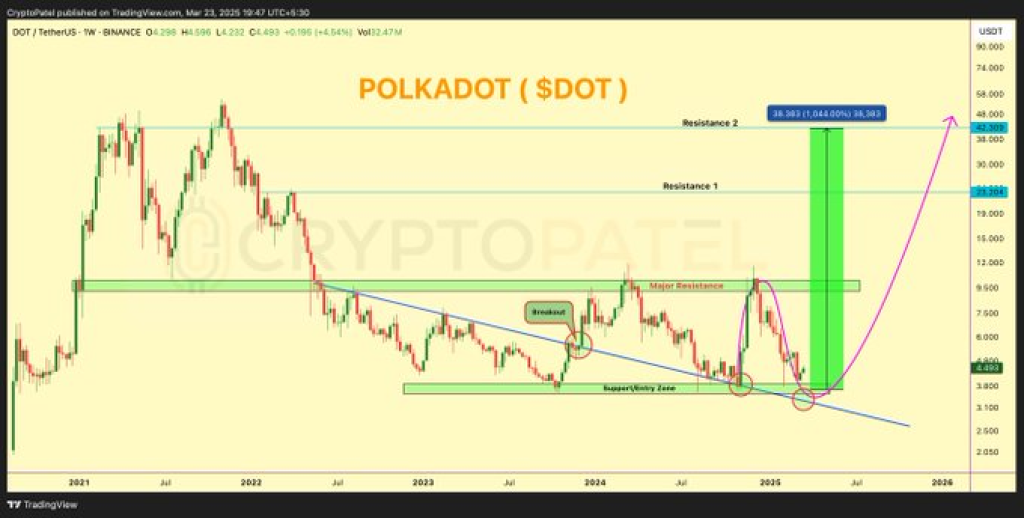
Polkadot (DOT) is back on the radar after a technical chart from analyst Crypto Patel made the rounds on X (formerly Twitter). Right now, DOT’s price is sitting around the $4 mark and seems to be holding steady in a well-known accumulation zone that’s seen action in past cycles.
In his tweet, Crypto Patel pointed out the $3.50–$4.50 range as a key demand area. While many traders may have lost interest during the sideways movement, he suggests that long-term players are still quietly loading up. He also hinted that this kind of setup has often come before big moves in previous market cycles, possibly setting the stage for a run back to $50.
What you'll learn 👉
Polkadot Historical Support and Market Behavior
The DOT price weekly chart, published by Crypto Patel, spans from early 2021 to a projected 2026 outlook. It reveals consistent price behavior near the $3.50–$4.50 range. This zone has acted as strong support in multiple periods: 2022, 2023, and early 2025, where price reversals were observed.
This green-marked accumulation range is labeled a “historic demand area” in the tweet and aligns with key price bounces seen throughout the asset’s lifecycle. The DOT price chart also outlines a previously established resistance level at around $7.50, which has since turned into a potential support zone following a breakout.
DOT Resistance Levels and Chart Structure
The chart identifies two resistance zones. The first, near the $10–$11.50 range, showed Polkadot’s price rejection in mid-2023 and early 2024. This level must be surpassed for bullish continuation. The second resistance is at $50, which is the former all-time high of the asset.
A 2021 to 2024 downtrend implies a breakout in mid-2023, then a successful retest in early 2025. The shape of the breakout, combined with the double-bottom pattern forming between 2023 and 2025, concurs with bullish reversal signals.
Read Also: The Real Reason Pi Network Is Not Listed on Major Exchanges Yet
Additionally, the chart outlines a potential uptrend since early 2025. A green arrow projects a parabolic move from the $4.25 level toward $50. This projection suggests a gain of over 1,000%, echoing market cycles seen during previous bull runs.
The tweet reinforces this scenario by referencing the cyclical nature of the market and the strategic positioning of long-term investors during low sentiment phases.
Polkadot Market Sentiment and Technical Positioning
The broader market for DOT price reflects prolonged consolidation and lowered retail interest. However, the current technical setup indicates that the asset is maintaining key structural support while forming bullish patterns.
Crypto Patel’s analysis offers a structured overview of price action, resistance levels, and projected growth, based solely on historical performance and chart indicators. The scenario remains dependent on broader market conditions and continued adherence to the projected technical path.
Subscribe to our YouTube channel for daily crypto updates, market insights, and expert analysis.

We recommend eToro
Wide range of assets: cryptocurrencies alongside other investment products such as stocks and ETFs.
Copy trading: allows users to copy the trades of leading traders, for free.
User-friendly: eToro’s web-based platform and mobile app are user-friendly and easy to navigate.