SEI has one of those charts that starts making a lot more sense once you stop looking at it as a trend and start seeing it as a range. Price has been moving between a clear top and a clear bottom for a while now, and the latest move fits perfectly into that story.
As AltCryptoGems pointed out, we’ve seen a deviation at resistance and now another one at support. When both of those show up in the same range, it usually means the market is busy clearing out liquidity before choosing a direction.
What you'll learn 👉
The SEI Range Is Doing the Talking
If you look at the chart Sjuul shared, there’s a clear resistance zone sitting around the $0.133 to $0.134 area. That level rejected the SEI price pretty aggressively after a brief push above it.
That’s a classic deviation, where price looks like it’s breaking out, pulls in buyers, and then quickly snaps back under the level. That kind of move often tells you the market wasn’t ready to trend higher just yet, at least not on the first attempt.
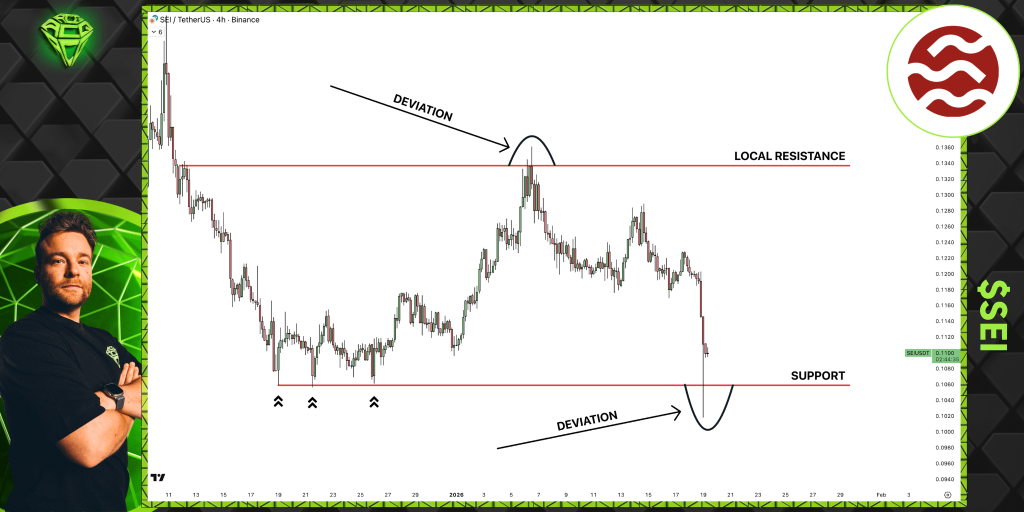
On the flip side, support sits down around the $0.106 to $0.107 area. That level has been tested multiple times, which is why those equal lows matter so much. Markets love targeting equal lows because that’s where stop orders pile up, and SEI did exactly that.
Why the Support Sweep Matters
After rejecting resistance, the SEI price sold off hard and briefly dipped below support. That wick below the level is important because the price didn’t stay there. It dropped, grabbed liquidity, and then climbed right back above support.
That quick reclaim changes the whole tone of the move. A clean break below support usually leads to more downside. But a deviation followed by a fast recovery often signals that sellers tried to take control and failed.
Right now, the SEI price is back above support, which puts the focus on whether buyers can actually defend this area instead of letting price slip back below it again.
Read Also: XRP Price Prediction Turns Extreme: Multi-Year Structure Points to $10+
What’s Next for SEI?
As long as the SEI price holds above that support band, the range structure remains intact. In that scenario, a rotation back toward resistance becomes the most natural path, since price has already shown it likes moving between those two levels.
If, however, the SEI price loses support again and starts closing below the $0.106 area, then the structure weakens and the market may need to build a new base before any meaningful bounce can happen.
Right now, SEI isn’t showing a clean trend in either direction. It’s showing a battle inside a range, and the market just ran a liquidity sweep at the lows. As long as the SEI price stays above support after that move, the setup leans toward another push back into the upper part of the range.
Subscribe to our YouTube channel for daily crypto updates, market insights, and expert analysis.