This week is going pretty well for crypto, with Bitcoin now well above $58k. Some altcoins are pumping as well, and among the top gainers today is, once again, SUI.
We say “again” because SUI has been consistently in the top gainers list over the past few weeks. This is currently one of the fastest-growing L1 blockchains in the crypto space.
The SUI price pumped 17% today, pushing it above the psychological $1 level. This area acted as strong resistance twice in August, so flipping it into support would be a positive sign for SUI holders.
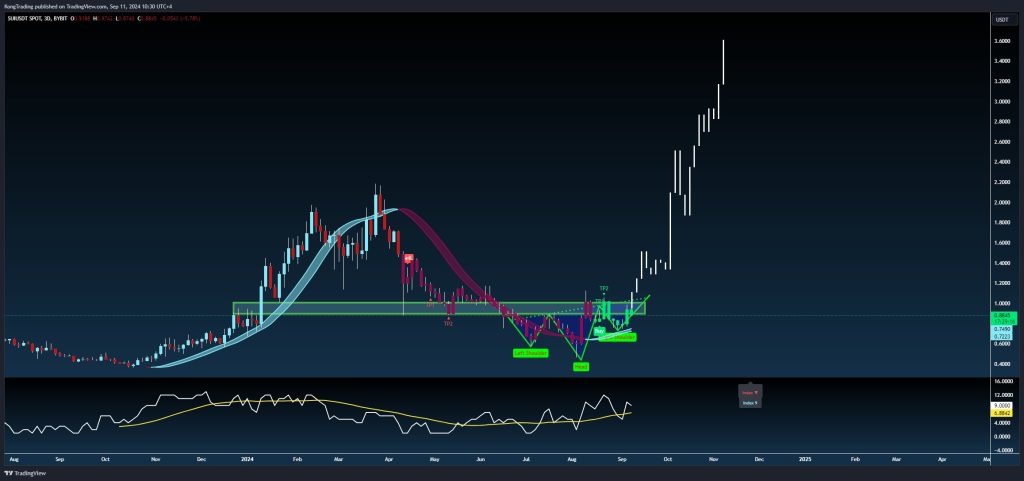
Crypto trader “Kong,” who has a massive following on X with over 130k followers, posted a SUI chart predicting more pumps on the horizon.
What you'll learn 👉
SUI Chart: Technical Analysis Breakdown
Kong’s chart reveals several interesting technical patterns and indicators. An inverse head and shoulders pattern has formed, with the left shoulder near the $0.70–$0.80 range, the head dipping to around $0.60, and the right shoulder bouncing off the $0.75–$0.80 region. The recent breakout above the neckline of this pattern is fueling the current bullish momentum.
The 17% pump today suggests buying pressure, confirmed by the breakout from the inverse head and shoulders pattern. This pattern often signals a bullish reversal, indicating potential for further upward movement.

Additionally, the SUI chart shows an EMA ribbon crossover just before the price rally, which is typically considered a bullish sign. Key support remains around $0.85–$0.90, a level to watch if a pullback occurs after today’s pump.
SUI Price Forecast
Looking ahead, several key levels and targets emerge. The immediate target appears to be around the $1.20 level, based on previous structure and resistance levels. If momentum continues, we could see the SUI price testing the $1.50 range, with potential long-term targets in the $2.00–$3.00 range.
Doge2014 raises 500K in days celebrating Dogecoin. Make potentially big profits and get in on exclusive airdrop!
Show more +Immediate resistance might be encountered around the $1.20–$1.30 region, where sellers could step in. If the rally sustains, expect further resistance at $2.00, which would be a significant psychological level for traders.
It’s worth noting that the RSI is showing strong momentum, pushing into overbought territory. This indicates the current rally is strong but may face a short-term correction or consolidation.
Subscribe to our YouTube channel for daily crypto updates, market insights, and expert analysis.
We recommend eToro
Wide range of assets: cryptocurrencies alongside other investment products such as stocks and ETFs.
Copy trading: allows users to copy the trades of leading traders, for free.
User-friendly: eToro’s web-based platform and mobile app are user-friendly and easy to navigate.


