
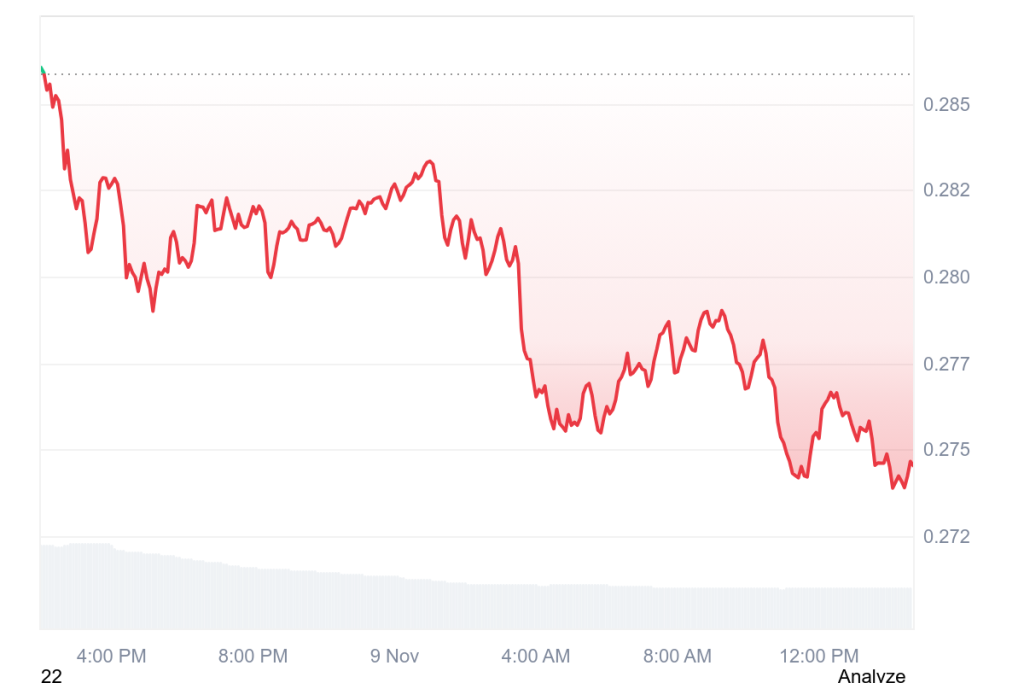
The Stellar price has been under pressure over the past day, sliding from the upper $0.28 area toward the low $0.27s.
The XLM chart shows a steady drift lower, with weak rebounds and consistent lower highs and naturally, traders want to know what’s driving the drop.
In this case, it’s a mix of network worries, competition heating up, and a technical breakdown that arrived at the wrong time.
What you'll learn 👉
Network Issues Are Still Casting a Shadow Over Stellar
The first spark came from Stellar’s own ecosystem. A state-archival bug on Soroban, the network’s smart-contract layer, caused enough trouble to trigger an 8.2% drop on November 8.
Even though the issue was fixed relatively quickly, it left traders uneasy. When a blockchain positioned for institutional use cases experiences a stability hiccup, confidence doesn’t bounce back immediately.
On top of that, Stellar isn’t the most liquid asset in the market. Its turnover ratio sits around 1.86%, which means any negative news tends to move the price more sharply than usual. With thin liquidity and shaken sentiment, sellers had an easier time pushing the XLM price lower.
Looking ahead, everyone is watching Protocol 23, the network’s next major upgrade. If Stellar successfully rolls out its targeted 5,000 TPS throughput improvement, some of the fear may fade. If it doesn’t go smoothly, the current defensive mood could get worse.
XLM Is Losing Momentum as Traders Rotate Into Stronger Performers
The second issue is simple: traders are chasing what’s hot, and right now, that’s not XLM. Privacy coin Zcash (ZEC) has been on a massive run, up more than 1,100% year over year, and its surge pushed Stellar down the rankings.
This doesn’t necessarily mean Stellar is failing. Developer activity on the network grew 37% in Q3, and Soroban smart-contract usage jumped 700%.
But growth behind the scenes hasn’t translated into price momentum, and in a market obsessed with fast-moving narratives, that matters. XLM is basically stuck in the middle: strong fundamentals, but no hype.
XLM Technical Indicators Are Pointing Lower
The chart is adding to the pressure. The XLM price is below its major moving averages, including the 30-day SMA at around $0.31 and momentum indicators are flashing bearish signals. Both MACD and RSI have weakened, confirming the downtrend.
The zone between $0.266 and $0.277, which previously acted as support, has flipped into resistance. That’s exactly where the latest bounce attempt stalled. If the sell-off continues, the next meaningful support sits near $0.238, which lines up with the 78.6% Fibonacci retracement.
One more problem: volume is down almost 50% from its 24-hour average. When buyers disappear, even small sell-offs push the price lower.
Read Also: Will the Stellar (XLM) Price Dip From Here? Key Indicator Points to a Reversal
What’s Next for XLM?
The XLM decline isn’t coming from just one issue, it’s the combination of recent network instability, stronger competition stealing the spotlight, and a clear technical breakdown.
Stellar still has major long-term partnerships and a solid roadmap, but right now the market wants proof that the trend can reverse. Reclaiming $0.28 is the first step toward shifting sentiment.
Subscribe to our YouTube channel for daily crypto updates, market insights, and expert analysis.