
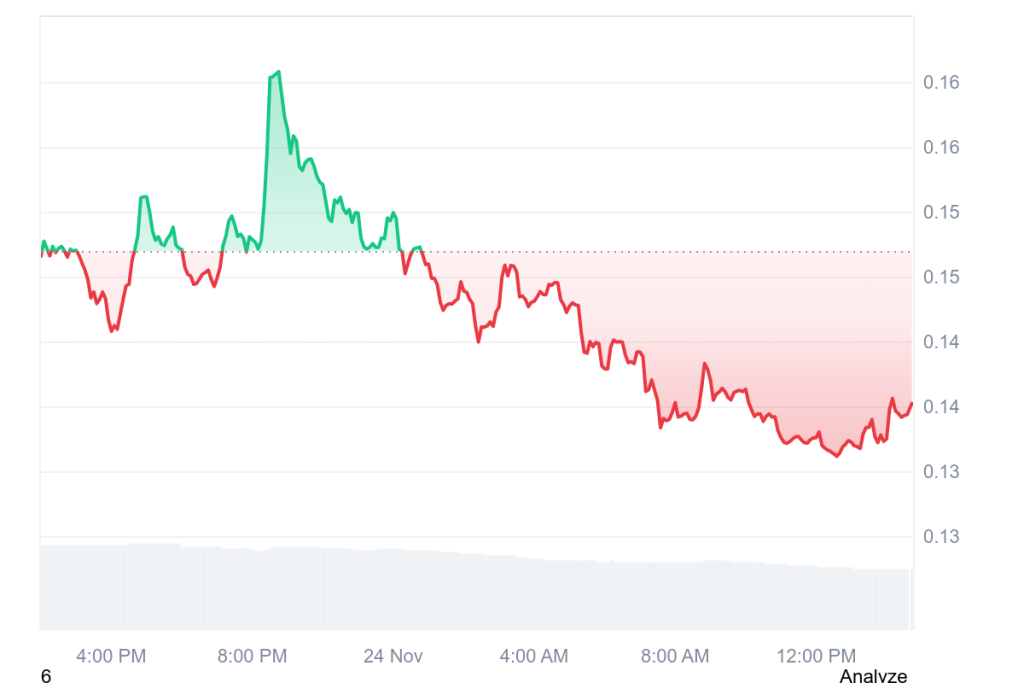
Starknet hasn’t had the smoothest trading day. After a strong run earlier this month, the STRK price has slipped to around $0.14, and the latest chart shows a steady fade into the red.
Naturally, traders are wondering what caused the drop and whether it’s temporary or something more concerning.
Looking at the data, today’s pullback seems to come from a mix of profit-taking, shaky sentiment, and technical weakness rather than a single headline.
What you'll learn 👉
STRK Sees Profit-Taking After a Big Rally
This dip didn’t come out of nowhere. Between November 5 and 21, the STRK price rallied more than 110%, climbing all the way to about $0.28.
That spike was fueled by excitement around Starknet’s BTC staking integration and a growing privacy narrative tied to Zcash. After a move that big, it’s normal for traders, especially those who bought earlier to lock in profits.
We’re seeing signs of that in liquidation data too. According to Coinglass, this week saw approximately $1.2 million in long liquidations, meaning leveraged positions got flushed out and added extra selling pressure.
Before reversing, the STRK price approached its 200-day moving average at around $0.135, which tends to act as a psychological resistance zone.
Holding above the 30-day SMA at approximately $0.148 would stabilize things, and any close below $0.135 would make traders have second thoughts.
Read Also: Starknet (STRK) Price Explodes 50% – Here’s What This Chart Pattern Signals Next
Bitcoin Pulled Altcoins Down With It
Starknet isn’t struggling alone. Bitcoin dropped about 1.7% to $86,500 on November 24, and most altcoins reacted the same way, including STRK.
Over the past day, the token has shown almost perfect correlation with BTC, meaning it’s moving in sync with the broader market. Sentiment hasn’t helped either.
The Crypto Fear & Greed Index just fell to “Extreme Fear” at 12/100, which usually means traders are being cautious, liquidity dries up, and riskier assets get hit first. STRK is simply caught in that wave.
Technical Levels Are Under Pressure
From a chart perspective, things look a bit fragile. The STRK price recently fell below the 50% Fibonacci retracement level at $0.186 and slipped under its 7-day SMA at $0.195.
The RSI sitting near 40 shows that sellers still have momentum, and the negative MACD histogram supports the bearish trend.
Now, all eyes are on the $0.135–$0.142 support range, where the 200-day EMA and 61.8% Fib level meet. If that area holds, the STRK price could bounce. If not, traders may start looking back toward the September low near $0.095.
Where Does STRK Go From Here?
Nothing about Starknet’s long-term story has changed, BTCFi adoption, staking growth, and strong network fundamentals are still in place.
Right now, though, short-term sentiment is being driven by market fear, profit-taking, and broken support levels. A recovery isn’t off the table, especially if Bitcoin steadies and STRK protects key support. But until momentum flips, traders may remain cautious.
For now, the market just needs time to decide whether this is a healthy cooldown, or the start of a deeper correction.
Subscribe to our YouTube channel for daily crypto updates, market insights, and expert analysis.