The RAVE price is up 56% in the last 24 hours, touching $2.06 while the rest of the crypto market barely moved. Total market cap climbed just 0.85% in the same period. That means RaveDAO is doing something entirely on its own.
Volume moved 41.5% to $394 million, and the turnover ratio of 0.8 tells us this is not a thin order book pump. Real money is moving. But here is the weird part. No clear catalyst. No announcement.
What you'll learn 👉
What the RAVE 4-Hour Chart Shows Right Now
We had a look at the RAVE 4-hour chart, and the technical picture is extreme. The RAVE price is trading at $2.04 after hitting a high of $2.17 and a low of $1.95 in the last session. That is a tight range for a 56% move, which tells you how fast the candles printed.
The 100-period SMA sits way down at $0.41. That is how far and how fast this move has been. Price is literally 400% above its longer term average.
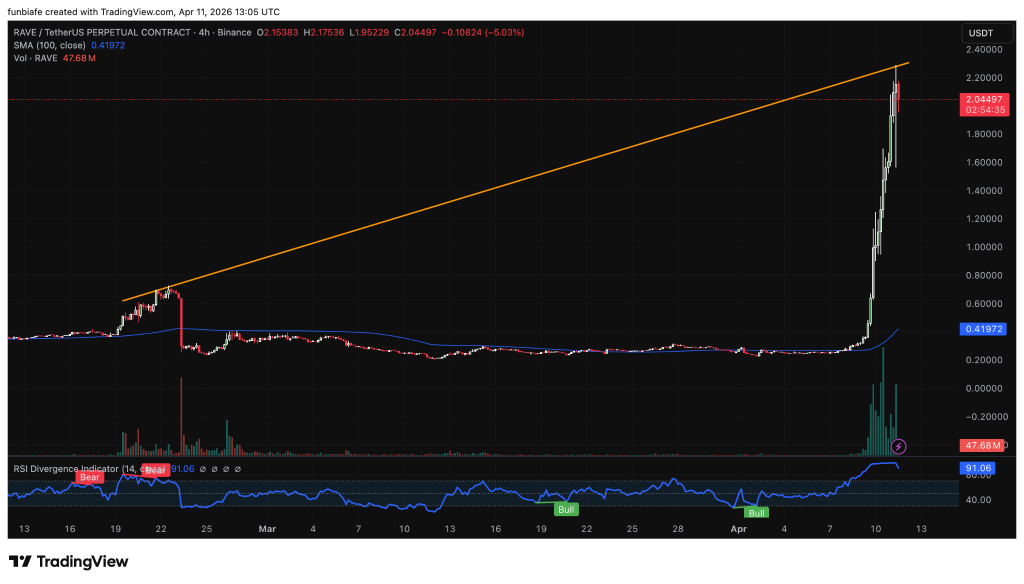
The RSI divergence indicator on the chart is flashing something important. It shows a bearish divergence forming at the top. Price made a higher high, but the RSI made a lower high. That is classic exhaustion.
The indicator labels it as “Bear” at the current peak while the previous leg was “Bull.” That does not mean the RAVE price crashes tomorrow, but it does mean the rocket is running low on fuel in the very short term.
Read Also: Gold Overtakes Adjusted Dollar Reserves for the First Time
Why No One Can Find a Catalyst
The data does not show any clear secondary driver. The Altcoin Season Index actually fell 11% to 32, so this is not a rising tide lifting all boats. Social media is quiet on any RaveDAO news.
The move looks like pure speculative momentum driven by volume. Sometimes that happens in crypto. A coin catches a bid, leverage traders pile in, and the RAVE price runs away from fundamentals.
The problem is that moves without catalysts are harder to trust. They can reverse just as fast as they started. The $394 million in volume is real, but volume can vanish overnight. When that happens, the RAVE price tends to fall back to where it started.
Read Also: Crypto Price Prediction for Today, April 11: XRP, Bitcoin (BTC), Arbitrum (ARB)
What Could Happen Next to RAVE
The near term outlook comes down to one level: $1.80. If the RAVE price holds above that support zone, the market can digest the gains and potentially retest the $2.20 to $2.50 area. That is the next resistance band based on the current range.
But if the RAVE price breaks below $1.80 on rising sell volume, the bullish structure breaks. A drop toward $1.50 would be the likely outcome.
The trend is still bullish. No one denies that. But the RAVE price is overextended in the short term. The RSI divergence is a warning. The lack of a catalyst is a risk. The volume is the only thing holding this together.
Subscribe to our YouTube channel for daily crypto updates, market insights, and expert analysis.