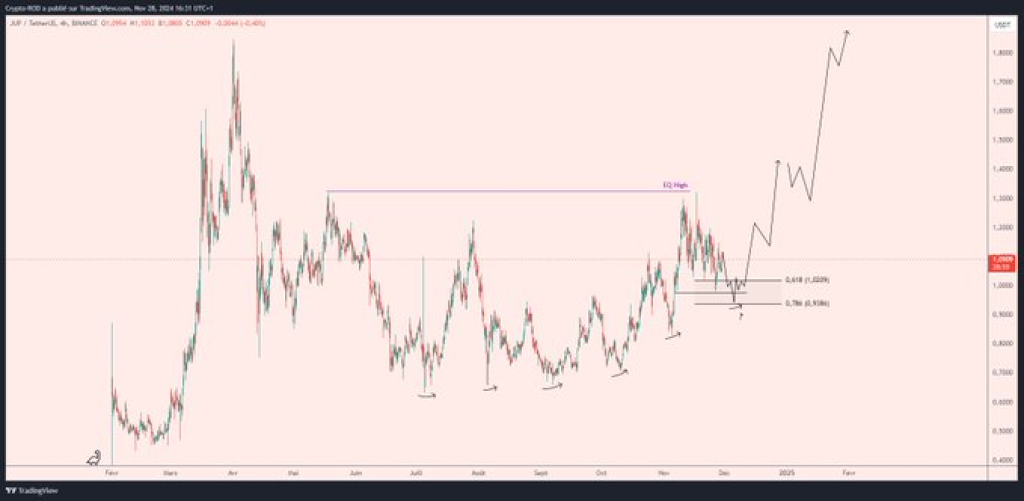
The price of Jupiter is forming a steady pattern, suggesting it could make a compelling move soon. Prominent trader Crypto-ROD shared on X that the token is forming a notable swing long setup, with key support levels offering a promising buying opportunity. This analysis is further supported by detailed chart observations, highlighting the token’s recent trends and potential future trajectory.
What you'll learn 👉
Jupiter Chart Analysis: Consolidation Phase Suggests Accumulation
JUP’s price has been trading within a consolidation pattern, characterized by a narrowing range following a significant rally earlier in the year. The chart analysis reveals that this phase reflects a buildup of market activity, often seen before a breakout. Resistance has been identified near the $0.12–$0.13 range, labeled as the “EQ High” on the chart, while support lies within key Fibonacci retracement levels of $0.084 and $0.08.
These levels align with the Optimal Trade Entry (OTE) strategy, often utilized by traders to identify potential reversals. The consistent formation of higher lows within the consolidation zone further points to a potential bullish trend.

Key Levels and Trading Strategies
Crypto-ROD noted the importance of the Fibonacci support zones as potential entry points. The trader has indicated interest in buying if Jupiter’s price reaches the OTE zone, where $0.084 and $0.08 levels offer strong support. These levels, derived from the 0.618 and 0.705 Fibonacci retracement metrics, are historically reliable for identifying zones of market demand.
The resistance at $0.12–$0.13 is critical to watch, as breaking above this level could signal a continuation of the previous bullish trend. Chart projections suggest that if this level is breached, JUP could see a significant upward movement.
Read Also: Is Kaspa Listing on Binance Imminent? KAS Price Eyes Range Highs
Momentum Building Ahead of Potential Breakout
Market analysts have observed that consolidation patterns, such as the one Jupiter (JUP) is currently experiencing, often precede a price breakout. The tweet from Crypto-ROD complements this analysis, with the trader’s confidence in the OTE area indicating a disciplined approach to identifying opportunities.
Although volume data is not explicitly shown, similar patterns often exhibit declining trading volumes during consolidation phases, followed by a sharp spike when the breakout occurs. This aligns with the potential for upward momentum in JUP’s price if it successfully moves beyond the resistance levels.
Subscribe to our YouTube channel for daily crypto updates, market insights, and expert analysis.
We recommend eToro
Wide range of assets: cryptocurrencies alongside other investment products such as stocks and ETFs.
Copy trading: allows users to copy the trades of leading traders, for free.
User-friendly: eToro’s web-based platform and mobile app are user-friendly and easy to navigate.


