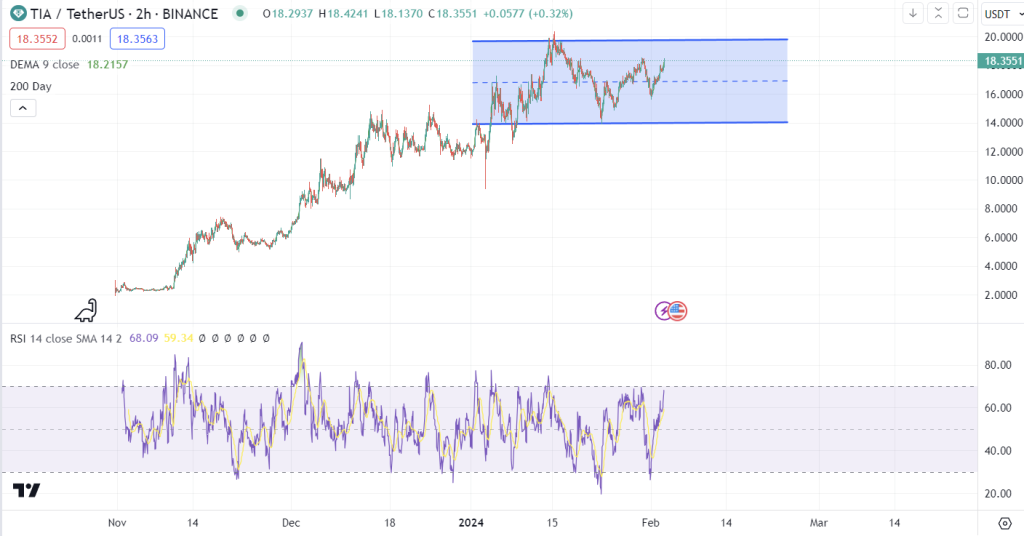
TIA, the native token of the Celestia blockchain, is one of the top performing major altcoins today amid broader market fluctuations. TIA is up around 8% today to trade around $18.36. We took a look at the TIA/USDT chart to see what’s going on from a technical perspective.
The blue channel on the chart shows that TIA has been trading inside this channel since early January. Strong support seems to be around $13.5 since the price rebounded and protected this level a few times in January. This level also aligns with the 1.618 Fibonacci retracement level.
Strong resistance looks to be around $19.8, which is also TIA’s all-time high set in mid-January. For TIA to push higher, the price needs to break above this level, which would also mean breaking out of the trading channel visible on the chart.

The RSI (Relative Strength Index) indicator across all time frames (daily, weekly, monthly, 3-months, 6-months) is between 60-70. The RSI measures the speed and magnitude of recent price changes to analyze overbought or oversold conditions. An RSI between 60-70 generally indicates bullish momentum without being overbought.
We also checked Celestia’s X (formerly Twitter) account, which has over 260k followers, indicating a strong community. The account is active and posting on a daily basis, which is a positive sign, but there were no major announcements that would explain today’s price surge.
Doge2014 raises 500K in days celebrating Dogecoin. Make potentially big profits and get in on exclusive airdrop!
Show more +In other recent Celestia developments, the project recently implemented the Celestia Improvement Proposal (CIP) process. Ethan Buchman has also joined the Celestia team as a CIP editor. Additionally, Skip Protocol formed a 50-person working group to provide recommendations for the CIP process. With Celestia’s ecosystem expanding, TIA prices rose in the last week of January.
In summary, TIA and the broader Celestia ecosystem seem to have positive momentum. While there was no major announcement to explain today’s price surge, technical factors like moving above key support levels and increased attention on developmental progress with the new CIP process likely contributed. As Celestia continues expanding, most signs point to additional upside for TIA prices.
However, TIA needs to break above the $19.8 resistance level and blue channel ceiling on the charts to sustain the bullish breakout. If those technical milestones are achieved, TIA could be poised for even more impressive gains ahead. For now, traders will be closely eyeing whether bulls can retain control and propel TIA out of its recent trading range.
You may also be interested in:
- Why Is API3 Price Up? Crucial Breakout Signals a Major Change of Direction
- Crypto Expert Forecasts Price Decline for Cardano’s ADA if This Key Resistance Continues to Hold
- Amid Chainlink’s Market Turbulence, NuggetRush Emerges as a Preferred Safe Haven for Investors
We recommend eToro
Wide range of assets: cryptocurrencies alongside other investment products such as stocks and ETFs.
Copy trading: allows users to copy the trades of leading traders, for free.
User-friendly: eToro’s web-based platform and mobile app are user-friendly and easy to navigate.


