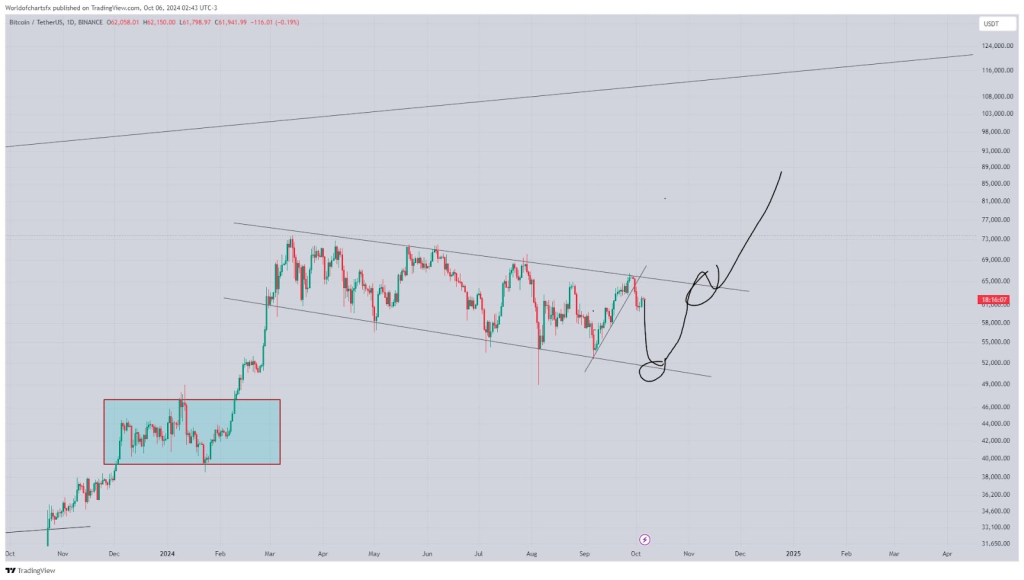
Two prominent analysts, World of Charts and Captain Faibik, share their insights on where Bitcoin’s price may be headed as Bitcoin is facing a crucial moment.
These analysts highlight possible price changes wherein Bitcoin might test lower support levels or rise to all-time highs. As Bitcoin’s price is settling in, investors are watching closely to determine when a breakout may occur.
What you'll learn 👉
Bitcoin Consolidating in a Descending Channel
World of Charts says Bitcoin’s price is still moving up and down within a pattern that’s going downward overall. He pointed out that Bitcoin recently couldn’t go higher than $64,000-$66,000. This has been a tough point for Bitcoin to get past, keeping it in a downward trend for now.

The lower part of the channel, identified between $51,000 and $53,000, serves as the critical support area. World of Charts suggests that Bitcoin could revisit this zone before attempting another breakout. This would be the worst-case scenario, as it would mean further downward movement before any bullish activity can be expected.
Doge2014 raises 500K in days celebrating Dogecoin. Make potentially big profits and get in on exclusive airdrop!
Show more +Potential for a Breakout Beyond $66k
World of Charts is upbeat about Bitcoin’s long-term prospects despite the cryptocurrency’s current grim short-term outlook. The expert believes that if Bitcoin breaks above the $64,000–$66,000 resistance, it may set new all-time highs. According to the analysis, once this area is cleared, Bitcoin may rise over its previous high of almost $69,000.
However, the descending channel pattern supports this prediction, with a breakout from the upper boundary potentially triggering a sharp upward movement. Traders will need to watch whether Bitcoin’s price can hold its lower support and build momentum for this move.
Bullish Sentiment Around $68k
Captain Faibik shares a similarly bullish view but focuses on a broadening wedge pattern. In this pattern, Bitcoin is seen approaching the $68,000 resistance level. Faibik suggests that a breakout from this wedge could result in a massive upside rally, pushing the price beyond $68,000.
The broadening wedge expands over time, with the lower boundary acting as support and the upper boundary as resistance. Faibik highlights the expectation of a positive surge during the next week, as Bitcoin moves closer to $68,000. Traders are waiting for confirmation of this breakout since the price has been rising.
Read Also: Analyst Says Cardano Chart Looks ‘Exactly’ Like Solana Before the Rally – ADA Price Prediction
Key Levels to Watch
Both analysts agree that the $68,000 mark is a crucial level for Bitcoin. While World of Charts focuses on the potential for Bitcoin to test lower support before breaking out, Captain Faibik sees the current trend leading to a rally.
Furthermore, to predict which of the two scenarios will occur, traders are keeping an eye on the spreading wedge and descending channel patterns. The next few days will determine the direction of the next significant move in the price of Bitcoin, which is displaying both upward and downward potential.
Subscribe to our YouTube channel for daily crypto updates, market insights, and expert analysis.
We recommend eToro
Wide range of assets: cryptocurrencies alongside other investment products such as stocks and ETFs.
Copy trading: allows users to copy the trades of leading traders, for free.
User-friendly: eToro’s web-based platform and mobile app are user-friendly and easy to navigate.


