
The price of Litecoin has continued its upward move with more than a 10% price increase in the past week.
Since May, the price has been bouncing off a descending trend line as resistance, and this has happened multiple times. Now that the price is close to this resistance again, Litecoin holders may need to be careful as the short-term bullish move may come to an end.
Let’s look at the possibilities for Litecoin in the medium term.
Doge2014 raises 500K in days celebrating Dogecoin. Make potentially big profits and get in on exclusive airdrop!
Show more +Read Also: AAVE Looks Ready for Next Leg Up as Bullish Metrics Align: Here’s the Price Outlook
What you'll learn 👉
Medium-Term Outlook for Litecoin
Here, we will be looking at what could happen to Litecoin price in the medium-term as the price approaches a critical level.
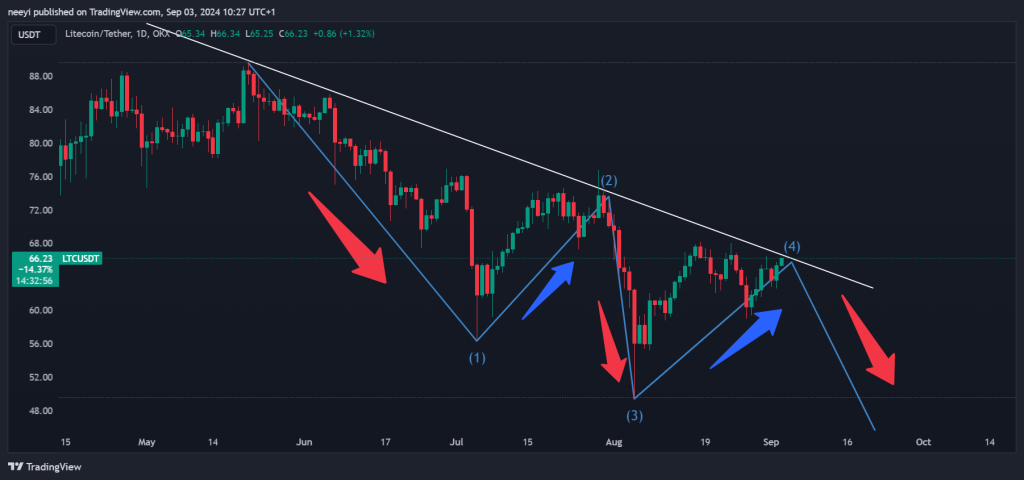
Bearish Outlook
Observing the descending trend line channel, we see that the price has been forming a lower high and lower low pattern. If the price continues this way, we expect Litecoin (LTC) to dip below the last lower low, around $49, in the coming weeks or months.
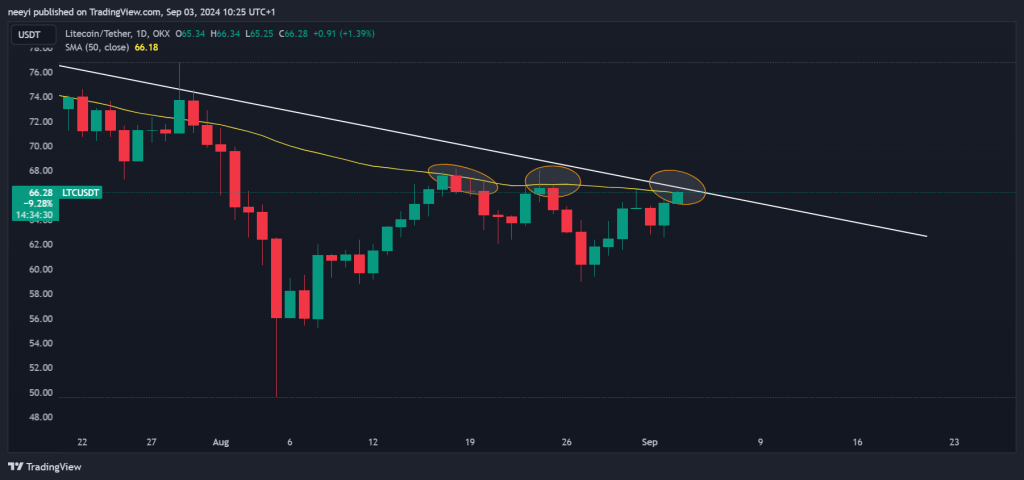
The 50-day simple moving average (SMA) is currently acting as resistance to further price growth. The daily chart shows that this level has been a point of reversal since mid-August, pushing the price down on August 18, 24, and 31.
With the price currently at that level again, we could see a repeat of the same action. However, given that the bulls are determined to break these levels, a break above this key level could trigger significant bullish momentum for a breakout above the descending channel.
Read Also: Is XRP Price Ready for a 2017-Like Bull Run? Ripple Analyst Eyes $18.22 Target
Bullish Possibilities
Looking at the bullish possibilities, a break above the trend line resistance could trigger substantial buying pressure for LTC, potentially initiating a medium-term rally.
However, this move is unlikely to be straightforward, as the price may encounter resistance at several key levels on its way up. One key level is around $75, and the next is near the top of the descending trendline at around $89.
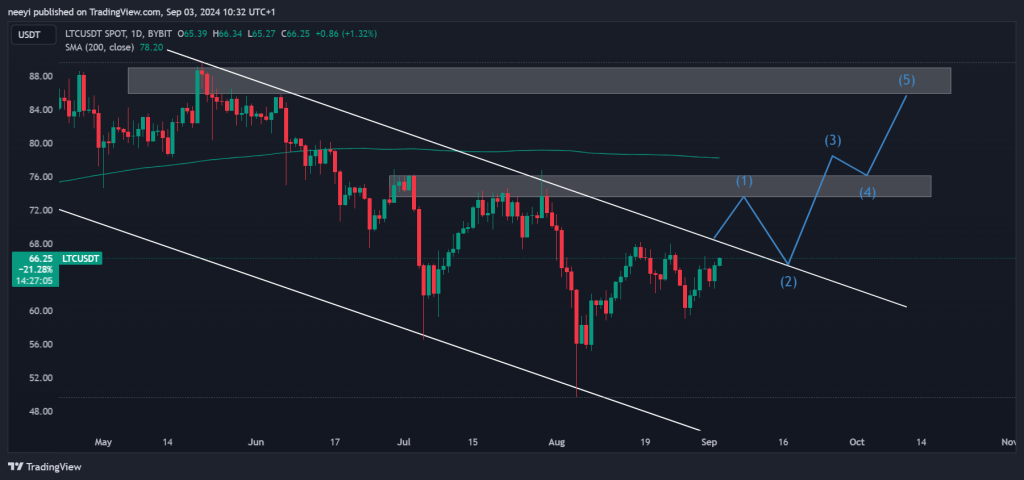
The 200-day SMA could also act as resistance to price growth in the medium term. The SMA is currently above the $75 resistance, which is also reinforcing resistance at that point, making it a critical level. A break above this level could be highly bullish.
The Relative Strength Index (RSI) is at 53, a neutral position, indicating that the price has room to move in either a bullish or bearish direction.
Subscribe to our YouTube channel for daily crypto updates, market insights, and expert analysis.

We recommend eToro
Wide range of assets: cryptocurrencies alongside other investment products such as stocks and ETFs.
Copy trading: allows users to copy the trades of leading traders, for free.
User-friendly: eToro’s web-based platform and mobile app are user-friendly and easy to navigate.


