Pi Coin has had a wild ride since its listing on Kraken. The cryptocurrency has gained more than 30% on the news of listing on Kraken. However, it has also declined substantially.
The question on everyone’s mind is whether the excitement is dying down or if this is a normal correction before the next leg up. The charts now show the PI price sitting at a critical juncture with key support levels in play.
What you'll learn 👉
Fundamental Developments Offer Context
The recent Pi Launchpad testnet release and Protocol v20.3 upgrades provide fundamental reasons for optimism. Smart contract activation enables peer-to-peer trading and opens the door for DeFi applications on the network. This may translate into real usage as developers begin to build on the platform.
Upgrades to required node software version 23.0, scheduled for Q2 2026, aim to improve scalability and stability and prepare the system for future growth. Compliance with MiCA regulations also opens doors to access the EU markets and potentially attract regulated capital through exchange listings.
However, the positives face some significant headwinds. Tokens on the horizon are a threat to the price of PI as continued selling pressure may limit upside and accelerate downward moves.
The 4-Hour PI Chart Shows a Sharp Pullback
Looking at the 4-hour chart, the PI price currently trades at $0.1958, down 0.91% on the session. Recent history tells a clear story.
The PI price moved to $0.2955 following the Kraken listing and Pi Day announcements, a move that represented massive gains for those who positioned early. Since that peak, the PI price has retraced significantly, falling back toward the $0.18 to $0.20 zone.
The pullback has been steep but orderly. PI found support near $0.1943 on this latest dip, with buyers stepping in to prevent a complete collapse. The question now is whether this support holds or gives way to further downside.
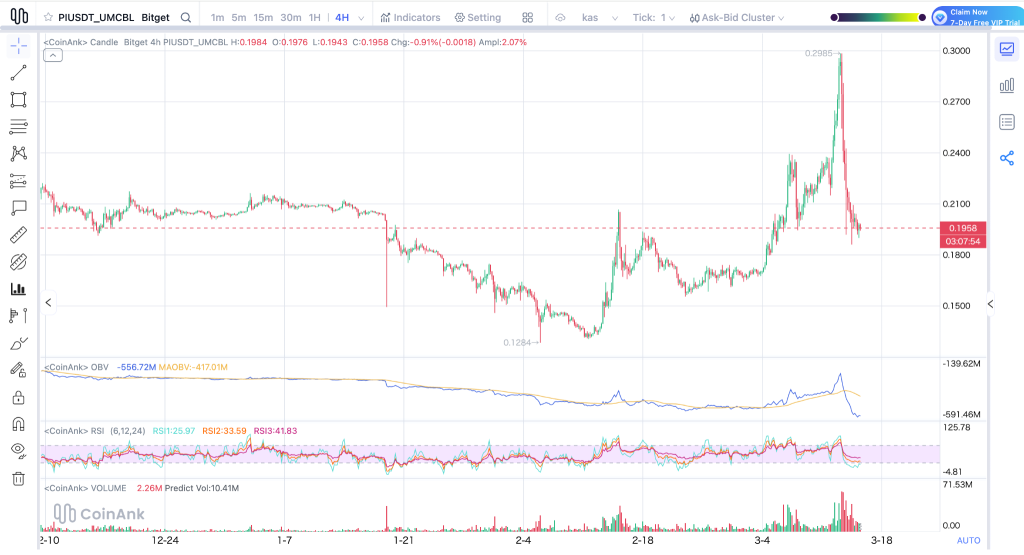
With Bollinger Bands, the PI price is placed hugging the lower side, while the upper band is placed at $0.24 and the middle at $0.21. This usually indicates a potential bounce if the buyers start to come back or a potential breakdown if the selling continues to put pressure on the price.
The RSI is giving out warning signals. The fast RSI is at 25.97, which is deeply oversold, while the medium is at 33.59, and the slow is at 41.83.
On-Balance Volume at -417.01 million confirms real selling, while volume at 2.26 million trails predicted 10.41 million, showing participation has dried up as the PI price pulls back.
Read Also: Chinese DeepSeek AI Predicts the Price of XRP and Pi Coin if the U.S. and Iran Agree to a Ceasefire
What Comes Next for PI
PI is also testing its strength on solid resistance levels of $0.21 and again on $0.24, while its latest high of $0.2955 represents its ambitious bull run target.
As for the bearish side of the chart, its support levels are on $0.1943 and again on $0.18, and a drop from here could propel its price to further declines towards $0.15.
Currently, PI is at a critical juncture on its price chart. Its fundamentals indicate some progress on its path forward, but its concerns regarding its token supply are limiting its gains. As for its immediate price action, its trading volume is light, and its price is lingering on its support levels.
This week will be crucial to see how PI responds to its current support levels and attempts to move back towards $0.21 or declines further towards $0.18 and lower.
Subscribe to our YouTube channel for daily crypto updates, market insights, and expert analysis.