
Monero has quietly turned into one of the strongest-performing large-cap charts in the market. Its weekly structure has been climbing in a clear parabolic curve since late 2024, and unlike many altcoins that move in choppy bursts, XMR’s trend has been steady and controlled.
Higher highs, strong weekly candles, and no major breakdowns, exactly what long-term traders want to see. But even with all of that strength, the XMR price is bumping up against a major multi-year resistance zone in the $400–$450 range. This level rejected price brutally in past cycles, including 2018 and 2021.
Now, the rally is testing that same ceiling again, raising the big question: does
Monero finally have enough momentum to break through?
What you'll learn 👉
Analyst Says XMR Has One of the Best Charts in the Market
Sjuul from AltCryptoGems summed it up clearly: “Monero is still one of the best-looking charts in crypto, probably the best-looking chart on bigger caps.”
His chart highlights exactly why. XMR is following a clean, curved trajectory upward, respecting its trendline and refusing to give up ground even during broad market pullbacks. But Sjuul also points out that despite its strength, the XMR price is still stuck under that same heavy resistance band. His question, “Break or die?”, captures the moment perfectly.
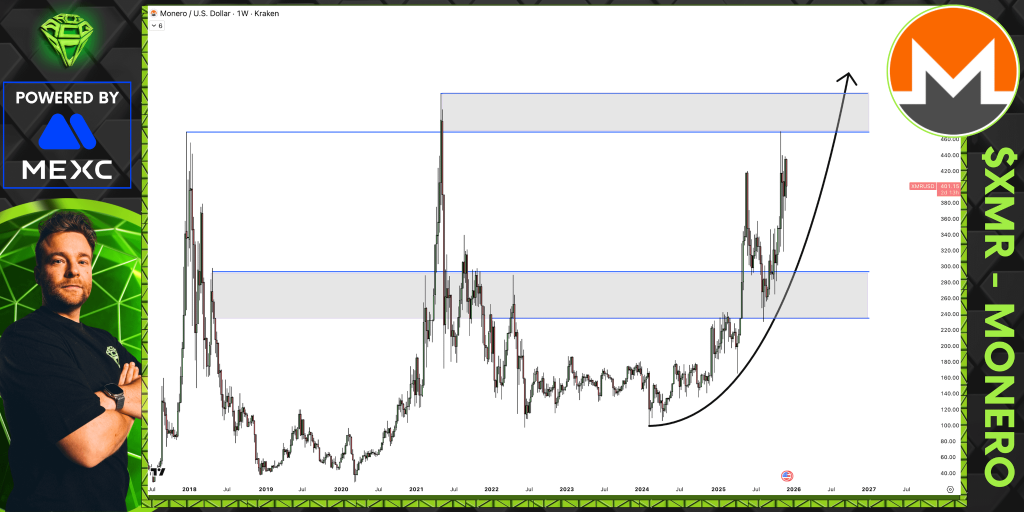
This is a textbook inflection point. If the XMR price breaks above the zone with strong weekly candles, the chart opens up dramatically. If not, it could be forced into another cycle of consolidation below it.
Bubble Risk Data Shows No Signs of Overheating
The bubble-risk chart from IntoTheCryptoverse gives an interesting perspective. Historically, whenever the XMR price entered the deep-red “bubble” zones, price peaked shortly afterward. Those spikes happened in 2017, 2021, and parts of 2022.
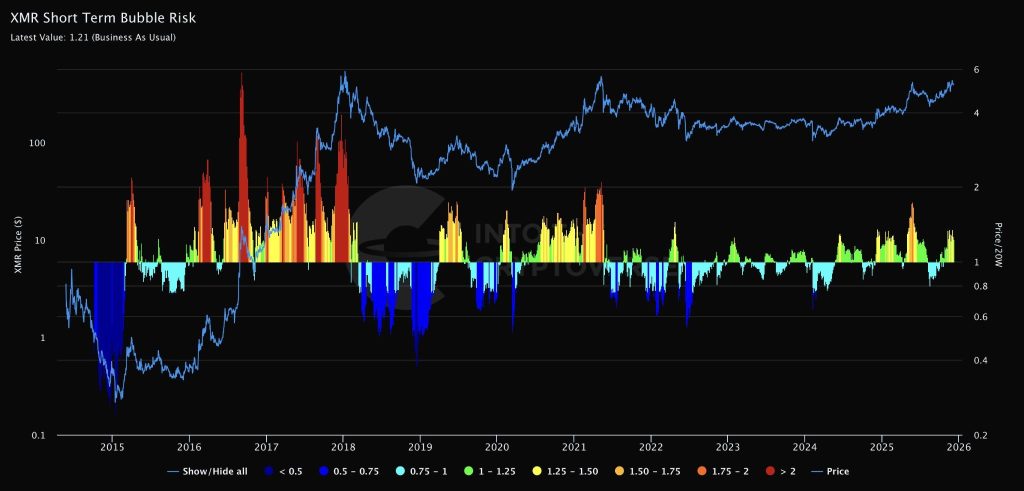
Right now, the bubble-risk reading is only 1.21, labeled “Business As Usual.” That means momentum is strong, but not euphoric.
No signs of retail mania, no sign of extreme leverage, just a steady trend grinding upward. This adds credibility to the idea that Monero might actually have room to break resistance without being overextended.
Read Also: Here’s Where XRP Price Could Go This Week
What’s Next for Monero?
Monero is sitting right at the edge of one of its most important technical zones in years. The trend is clearly bullish, the bubble indicators look healthy, and the parabolic curve hasn’t shown signs of fading.
If the XMR price breaks above the $400–$450 region with conviction, the chart could open up toward fresh highs in 2026. If it gets rejected, the mid-$300 range is the first logical support.
Either way, this is one of the most interesting setups in large-cap crypto right now, and the next few weekly candles may decide Monero’s entire 2026 trajectory.
Subscribe to our YouTube channel for daily crypto updates, market insights, and expert analysis.