
The Avalanche (AVAX) price is sitting at a huge level on its long-term chart, and analyst Crypto Patel thinks the next move could be a big one.
The price is now pushing into a trendline that has rejected AVAX four times before, and this fifth test might decide everything. A breakout could send it toward $100, while a rejection could drag it back toward $3.
The chart highlights both opportunity and risk, with the accumulation zone below acting as the key level AVAX has bounced from in previous cycles.
What you'll learn 👉
What the Analyst Is Seeing on the AVAX Chart
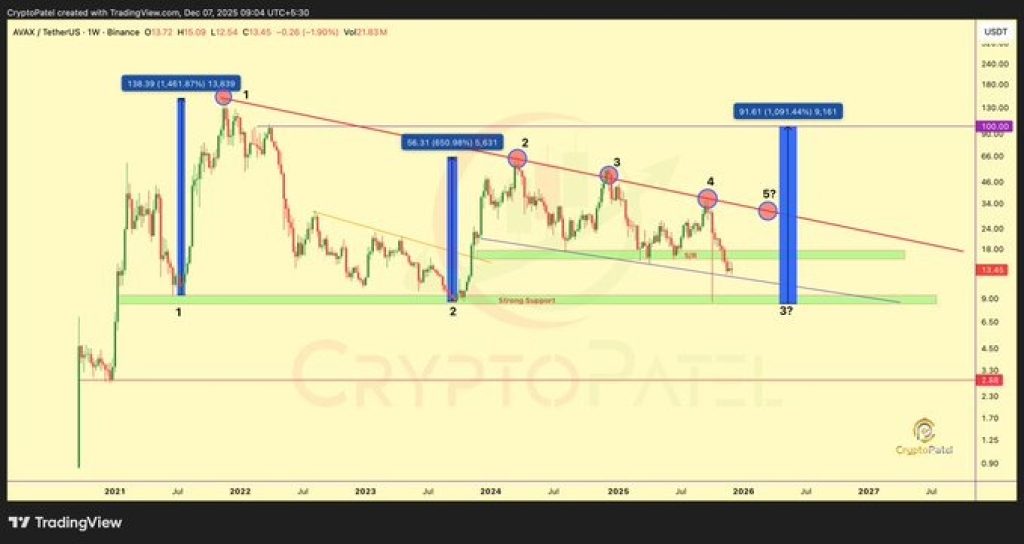
The chart shows a massive multi-year structure with three very clear phases: strong support at the bottom, repeated failures at the trendline above, and a wide middle range that AVAX has struggled to reclaim.
The most important detail Patel points out is the long-term descending red trendline, where the AVAX price has already been rejected four times. Each time price tapped this line, the move failed and momentum faded.
AVAX is now approaching the trendline again, this time near the $30 level. Patel says this fifth test could be the breakout attempt that finally sends price toward $100 if bulls push through.
The chart also shows how the AVAX price rallied +1,461% from the $8–$10 accumulation zone in 2021 and +650% from the same zone in 2023. This is why Patel calls it the “10x setup” if AVAX returns to this area.
Key Levels on the Avalanche Chart Right Now
The $16–$17 zone has flipped into resistance, which Patel calls the “bearish zone.” AVAX must reclaim this area to show real strength again. If price stays below it, momentum favors downside and the trendline test becomes much weaker.
Below this sits the green accumulation zone at $10–$8, the same place that triggered previous massive rallies.
Read Also: Here’s Why Bonk (BONK) Price Is Pumping Today
Patel notes that if the Avalanche price drops into this zone again, it could offer a powerful opportunity. The chart shows this zone has acted as the base for every large AVAX move in the past three years.
But Patel also highlights the risk: a break under $8 could send AVAX straight to $3–$2, where support becomes thin. This is the “freefall zone” on the chart and represents the bearish case if buyers fail to hold the accumulation level.
AVAX Price Short-Term Outlook
In the short term, AVAX is caught between two major forces: the trendline rejection risk and the historical strength of its accumulation zone.
Traders will watch how price behaves as it approaches $30, because a clean breakout above the trendline could quickly trigger momentum toward $50 and then $100. But losing $16–$17 again puts the focus back on $10–$8.
Crypto Patel’s message is simple: the Avalanche price is sitting at a decision point. The chart has produced huge rallies from this structure in the past – but it has also delivered brutal drops when support failed. The next move is likely to be big, whichever direction it takes.
Subscribe to our YouTube channel for daily crypto updates, market insights, and expert analysis.