March was challenging for AAVE as it moved steadily lower within a falling wedge pattern. Despite the drop, buyers showed signs of strength near the end of the month. Now, with April underway, many are wondering if a bullish breakout is on the horizon.
We turned to ChatGPT for predictions, and it provided three outlooks, pessimistic, realistic, and optimistic, based on AAVE’s price trends, technical indicators, and market activity.
What you'll learn 👉
An Overview of AAVE in March
AAVE opened in March around $190–$200 before entering a consistent downtrend. AAVE price action was confined within a falling wedge, a chart pattern typically seen as a bullish reversal setup. The token bottomed out at $150 mid-month, a key support zone that was held multiple times throughout March.
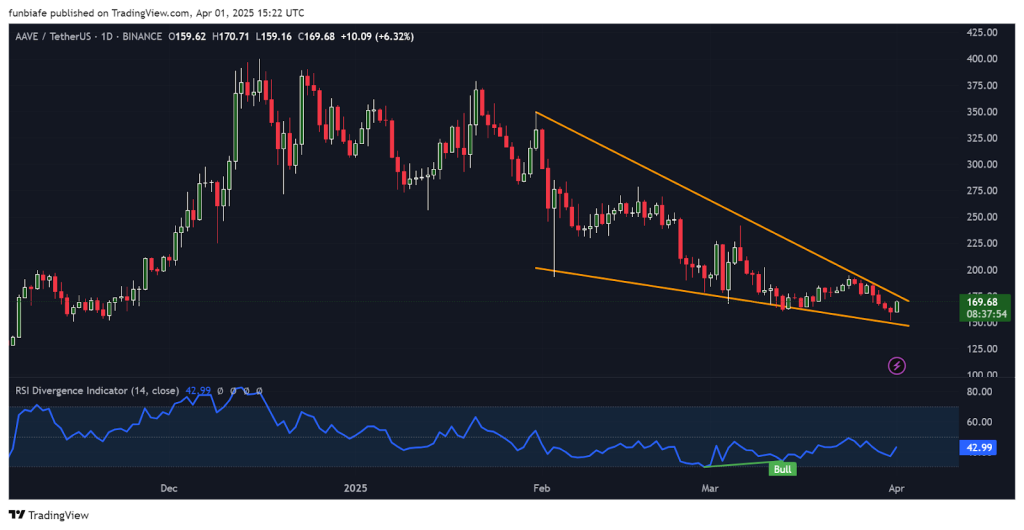
Despite low momentum, a bullish daily candle formed on March 31. AAVE then bounced off the wedge’s lower trendline and climbed 6.32% on April 1, closing at $169.68. Momentum indicators also reflected a shift: the 14-day RSI stayed between 30 and 45 for most of March, showing a bullish divergence as the RSI made higher lows while AAVE price continued making lower lows.
The following sections summarize what ChatGPT expects for AAVE in April:
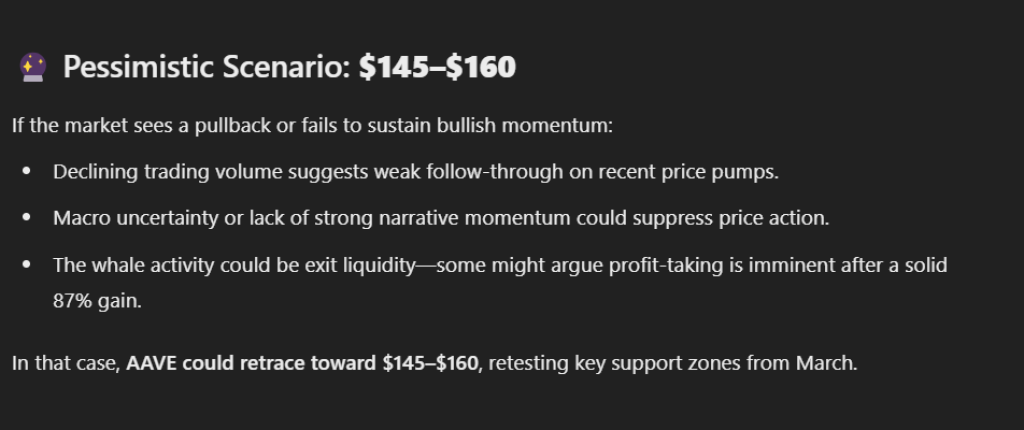
Pessimistic Scenario
Price Range: $145–$160
AAVE could see a pullback if bullish momentum fades. The recent rise in AAVE price came alongside a 15.93% drop in trading volume, suggesting weak follow-through. If the broader crypto market stalls or turns bearish, AAVE might revisit its March support zone.
Some analysts also caution that recent whale accumulation might shift to profit-taking after AAVE’s prior 87% rally. If that occurs, the $150 area may come under pressure again.
Key insight: If the price fails to reclaim resistance around $180, AAVE could enter another consolidation phase between $145 and $160.
Read Also: We Asked AI to Predict Cardano (ADA) Price in April
Realistic Scenario
Price Range: $180–$200
A steady climb appears more likely if current support holds. The falling wedge pattern is nearing its apex, and the confirmed RSI bullish divergence adds to the case for a breakout. AAVE’s weekly $1 million token buybacks and strong fundamentals may act as a cushion for downside risk.
Total value locked (TVL) metrics also show growth, with AAVE reclaiming its leadership among DeFi protocols. If ETH and BTC remain stable, altcoins like AAVE could follow with moderate gains.
Key insight: AAVE price may trade between $180 and $200 if volume increases and the wedge breakout is confirmed in early April.
Optimistic Scenario
Price Range: $220–$250
A stronger breakout could develop if April brings renewed bullish sentiment to the crypto market. AAVE’s fully circulating supply and consistent buybacks create the potential for a supply squeeze. Whale accumulation and outperforming metrics, such as higher ETH-denominated borrowing, support this outlook.
If the token breaks above $190 with strong volume, price discovery may extend toward the $220–$250 range. DeFi narratives shifting back to lending protocols would also favor AAVE.
Key insight: A confirmed breakout above $190 could set the stage for a sharp move to the $220–$250 zone.
Final Thoughts
March closed with bullish signals on both the price chart and momentum indicators. As long as the price of AAVE holds above $150 and volume supports the upward push, the wedge pattern remains valid. The breakout attempt during the first week of April will be essential in determining whether AAVE moves sideways, continues its climb, or sees a temporary reversal.
Subscribe to our YouTube channel for daily crypto updates, market insights, and expert analysis.

We recommend eToro
Wide range of assets: cryptocurrencies alongside other investment products such as stocks and ETFs.
Copy trading: allows users to copy the trades of leading traders, for free.
User-friendly: eToro’s web-based platform and mobile app are user-friendly and easy to navigate.