
TRON price is trading steady at around $0.365 after climbing for several weeks. The charts show that buyers are still in charge and the uptrend is holding strong.
Now the big question is whether TRX has the momentum to break through this key zone and keep pushing toward new highs.
On the daily chart, TRX price has been following a clean uptrend all year. Every dip has found strong support along an ascending trendline, and each bounce has confirmed the bullish structure with clear Break of Structure signals.
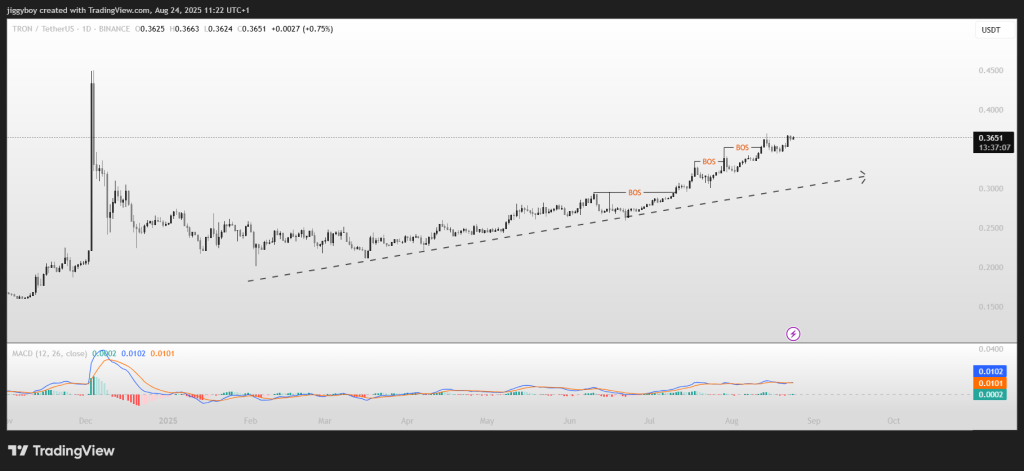
Right now, TRX price is pushing into the $0.365–$0.370 area, which is acting as resistance. If it breaks through, the next target looks to be around $0.38–$0.40.
The momentum side also looks good. The MACD is showing green bars again, and the lines are trending higher, signaling that bullish strength is still building.
TRON Price Chart Analysis: Bulls Defend the Trendline
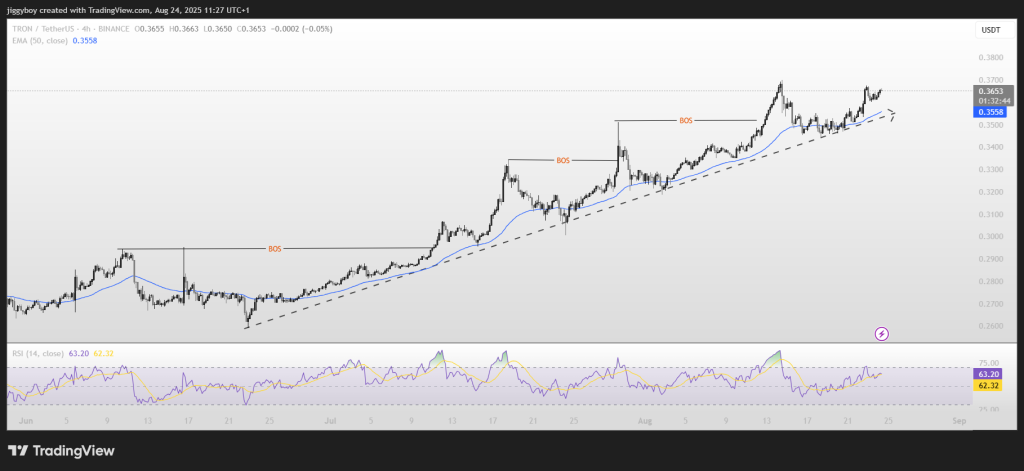
Looking at the 4H chart, TRX is riding its ascending support line really well. Every pullback has been caught near the 50 EMA around $0.355, and from there price has bounced higher. It’s a textbook uptrend: higher highs and higher lows, with buyers stepping in at every dip.
The RSI is sitting around 63, so it’s leaning bullish but not yet in overbought territory. That leaves room for another push before momentum cools off. As long as TRX holds above $0.35, the short-term structure stays strong.
Read Also: Analyst Predicts $7–$8 XRP Price in a ‘Few Weeks’
TRX Price Outlook
All in all, TRON price is one of the cleaner uptrends in the market right now. If bulls can push above $0.37, it could quickly extend toward $0.40. On the flip side, if the trendline breaks, the price could slip back to the $0.34–$0.33 range.
For now, though, the charts are showing strength. TRX is holding its ground, buyers are in charge, and the setup suggests the rally isn’t over just yet.
Subscribe to our YouTube channel for daily crypto updates, market insights, and expert analysis.