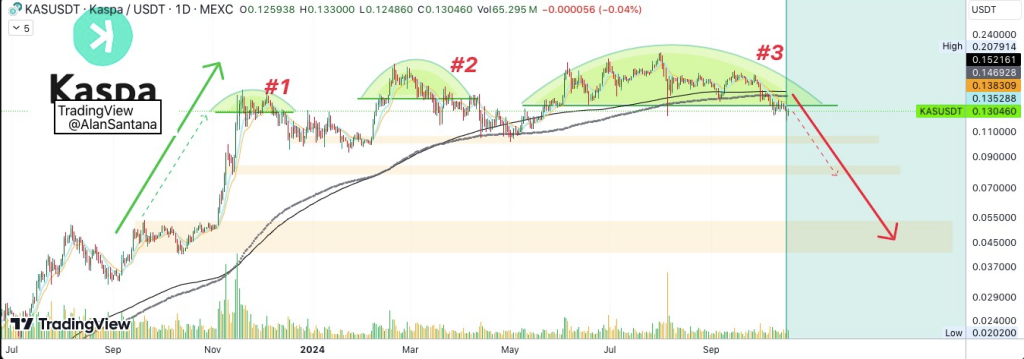
Kaspa (KAS) is facing heightened bearish pressure, as highlighted by a recent analysis shared by Trader Santana on TradingView. Santana’s observations indicate that KAS is at risk of a major decline, showing multiple bearish patterns on the daily chart.
The trader’s assessment warns of a possible price crash, urging investors to prepare for a downturn in either Kaspa or the broader crypto market.
The analysis begins by pointing to the formation of three rounded tops, a classic bearish reversal pattern. These patterns, observed over the past months, suggest that KAS has been gradually shifting from a bullish to a bearish trend. Rounded tops generally indicate weakening buying momentum, leading to lower highs and eventually a downturn.

Furthermore, the chart shows a “mirror image” pattern representing a bullish spike that has just been matched by a bearish downturn. This pattern is typified by a green upward arrow on the left, reflected by a red descending arrow on the right, implying that the former upward trend might turn around. According to Santana, this reflection is a strong indicator of a potential downturn for Kaspa.
What you'll learn 👉
Trading Below Key Moving Averages Adds to Bearish Outlook
Another critical aspect of Santana’s analysis is Kaspa’s position relative to key moving averages. KAS is currently trading below several levels, including the EMA233, MA200, EMA144, and EMA89. Falling below these moving averages often indicates sustained bearish sentiment, as these lines typically act as dynamic resistance.
Santana’s report emphasizes that the inability to reclaim these moving averages suggests continued downward pressure. Santana advises to watch for any attempts to break above these lines, as failing to do so could confirm the bearish trend.
Doge2014 raises 500K in days celebrating Dogecoin. Make potentially big profits and get in on exclusive airdrop!
Show more +Support Zones Highlight Potential Decline Targets
The current support level for KAS is around $0.130, where the price has been hovering. While this level has served as a minor support, Santana warns that a breakdown below it could lead to further declines. The analysis projects two critical support zones where KAS might find stability if the bearish scenario unfolds.
The first support zone is between $0.090 and $0.070, where previous consolidation might offer some relief. However, if KAS fails to hold within this range, the next target would be between $0.055 and $0.045, indicating a substantial decline from the current trading levels.
Read also: PENDLE Price Surges, Analyst Projects $20 Target for Q4
Low Volume Suggests Weak Buying Interest
Santana’s analysis also highlights declining trading volume, reinforcing the bearish outlook. Volume analysis is crucial in determining market interest, and the current trend suggests a lack of strong buying support. The reduced volume during price declines indicates limited enthusiasm from buyers, which could exacerbate the downward pressure.
Trader Santana’s message to followers is clear: prepare for a potential crash. KAS has shown consistent signs of weakness, trading below essential moving averages and forming patterns that point to a bearish trend.
Follow us on X (Twitter), CoinMarketCap and Binance Square for more daily crypto updates.
Get all our future calls by joining our FREE Telegram group.
We recommend eToro
Wide range of assets: cryptocurrencies alongside other investment products such as stocks and ETFs.
Copy trading: allows users to copy the trades of leading traders, for free.
User-friendly: eToro’s web-based platform and mobile app are user-friendly and easy to navigate.


