Oil price structure across the past 25 years is forming a story that stretches far beyond short term market noise. A detailed long range chart shared by commodities analyst Graddhy outlines a technical path that could define the next major phase of the global commodities cycle.
His earlier work identified the end of the bear market almost 6 years ago. Price behavior since that period continues to follow the same broad roadmap, which keeps attention on much higher long-term oil levels.
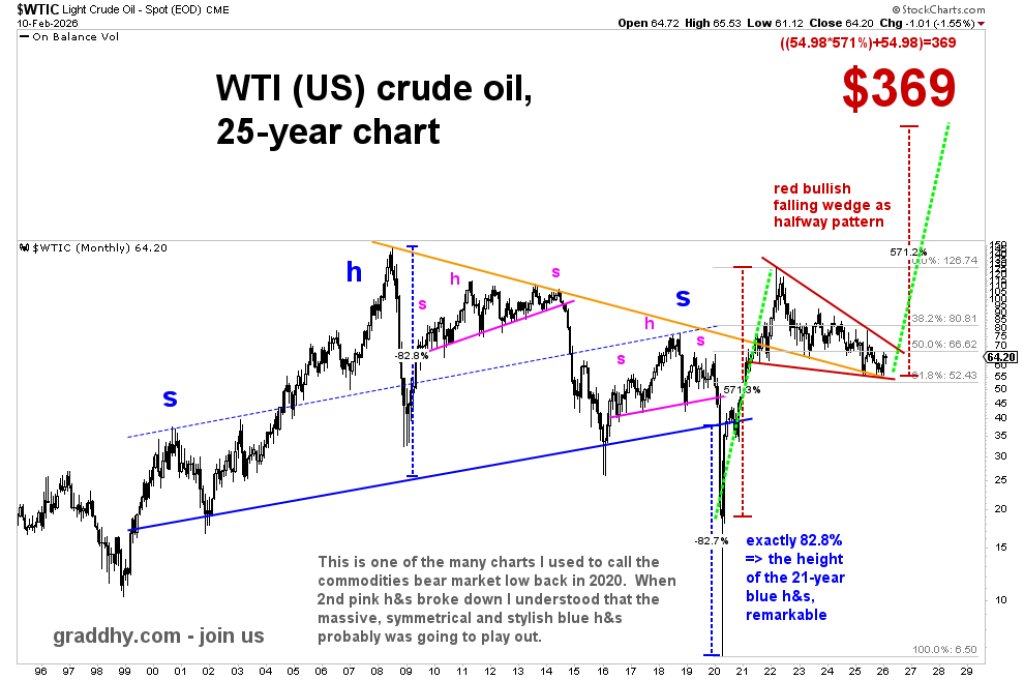
The current oil range near $64 sits inside a 4.5 year bullish falling wedge that Graddhy treats as a midpoint structure within a larger advance. Technical continuation theory treats halfway formations as dividing lines between two similar expansion legs. Measurement of the wedge height projects a possible destination close to $369 if the second leg unfolds with symmetry.
Earlier commentary from Graddhy placed oil near $58.40 when the same structure remained intact. Movement from that level toward the mid $60 zone keeps the broader thesis unchanged. The analyst connects this structure to earlier head and shoulders formations that shaped the transition into the pandemic crash.
Breakdown of the smaller pink pattern hinted that the massive blue structure would complete. That sequence later played out before commodities began their recovery phase.
Confidence in the present outlook comes from that historical alignment between structure and outcome. Long-duration charts often provide clearer signals than short-term volatility. Graddhy continues to rely on that higher timeframe perspective when defining the next oil cycle objective.
Oil Price Outlook Tied To A Second Inflationary Phase In Commodities
Graddhy links the technical setup to macro cycle behavior within commodities markets. Multi-year inflation waves often unfold in two distinct stages separated by consolidation.
Recovery from pandemic lows marked the first stage. Sideways compression inside the falling wedge may represent preparation for the second stage, which could extend far beyond previous highs.
Read Also: Silver Price Prediction: This Trader Just Mapped Silver’s Next Big Move
Supply discipline, underinvestment in production, and delayed response to demand shifts often create prolonged commodity expansions. These forces tend to appear slowly before price acceleration becomes obvious. The analyst views the present oil structure as an early position inside that broader expansion window rather than a completed move.
Future confirmation depends on structural breakout above wedge resistance. Sustained strength would keep the $250 to $300 region in focus before any discussion of the extreme $369 projection. Loss of support would challenge the timing of the cycle without erasing the larger framework built across decades of price history.
Subscribe to our YouTube channel for daily crypto updates, market insights, and expert analysis.