The BONK price recovered well during the ongoing market pump. Just last week, it pumped 70% and is now trading around $0.000020.
Popular analyst ‘Altcoin Sherpa’ updated his BONK price outlook and highlighted why he regrets not buying more BONK.
What you'll learn 👉
BONK Chart: Technical Analysis Shows Strong Bounce
Looking at the 4-hour chart of BONK against USDT on Binance, we can see key Fibonacci levels from 0.236 to 1.0. The chart highlights a green support zone between $0.00001637 and $0.00001594. Recent price action shows BONK trading at about $0.00002088.
The BONK price moved sideways from April 10-20 with a slight upward trend. Around April 22-23, it made a sharp rally. After reaching about $0.00002102, the price dropped to near the 0.382 Fibonacci level at $0.00001637. The price found support in the green zone and bounced back strongly.
BONK then reclaimed the 0.236 Fibonacci level ($0.00001815) and headed back toward its recent highs. The short-term trend is clearly bullish, with higher highs and higher lows forming a healthy pattern. The price respected important Fibonacci levels during its correction, which is a bullish sign.
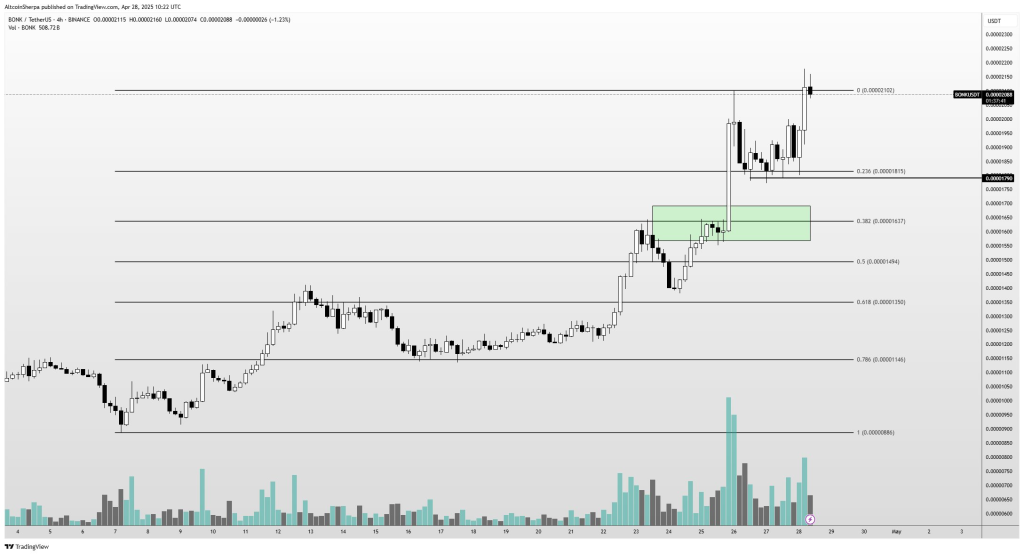
Trading volume increased during the breakout, which supports the upward move. Even during the correction, volume stayed relatively high, showing strong interest in BONK. The quick recovery after the sharp drop suggests strong buying momentum, with BONK now testing previous high levels again.
BONK Price: Support and Resistance
Strong support sits at the green box area ($0.00001600-$0.00001650). If a deeper pullback happens, the 0.5 Fibonacci level ($0.00001494) could provide additional support.
The immediate resistance is around $0.00002100-$0.00002150, where BONK peaked recently. If it breaks above this level cleanly, BONK could push toward new highs above $0.00002250.
The 0.236 Fibonacci level worked as a good bounce point during the recent upward move. The 0.382 level held firmly during the correction, showing buyers defended this price strongly. If we see another pullback, the 0.5 ($0.00001494) and 0.618 ($0.00001350) levels will be important to watch.
The Dog has more fun stuff coming at Accelerate 👀
— BONK!!! (@bonk_inu) April 28, 2025
Who’s gonna be in NYC?
Trader Sentiment
Altcoin Sherpa’s tweet adds important context to the chart. He had set a buy order likely near the green zone, but it was only partially filled. He bought a “tiny bit” manually and is now up about 10% on that position. His “sad” tone shows he regrets not getting a bigger position, but he still views the BONK chart as “fire” (very bullish).
The trader’s positive outlook matches what the technical analysis shows: a strong bounce from support, retesting of recent highs, no breakdown in structure, and good volume.
The trend remains bullish with higher highs and higher lows. Volume confirms the trend with strong spikes during key moves. The key support sits at $0.00001600-$0.00001650, with immediate resistance at $0.00002100-$0.00002150.
If BONK breaks above $0.00002150 with good volume, we can expect further upward movement. However, if it loses the green support zone, we might see a deeper correction toward $0.00001500 and possibly $0.00001350.
Based on the technical signals and recent price action, BONK appears well-positioned for potential further gains if it can overcome the current resistance level.
Read also: Why Is FLOKI Price Up? This Chart Screams “Next Meme Coin Rocket”
Subscribe to our YouTube channel for daily crypto updates, market insights, and expert analysis.

We recommend eToro
Wide range of assets: cryptocurrencies alongside other investment products such as stocks and ETFs.
Copy trading: allows users to copy the trades of leading traders, for free.
User-friendly: eToro’s web-based platform and mobile app are user-friendly and easy to navigate.