This Stellar Indicator Flashes “Buy” – Here’s What Happened to XLM Price the Last Time It Happened
A key signal just appeared on the Stellar chart, and it’s one that traders remember well. The TD Sequential indicator has flashed a new “9” on the weekly timeframe, the same buy signal that triggered a massive 95% rally the last time the XLM price was sitting at these levels.
Analyst Ali Martinez pointed this out along with a chart that looks almost identical to the setup earlier this year, and it’s already sparking fresh interest in what Stellar might do next.
What you'll learn 👉
A Familiar Buy Signal Right on Top of Stellar Support Zone
In Ali’s chart, the previous TD Sequential “9” printed when the XLM price had pulled back into the grey support band around the $0.23–$0.26 area.
That signal marked the bottom of the move, and Stellar went on to almost double its price in a short period of time. Now, XLM is back inside that same support zone, and the indicator has flashed the same “9” again.
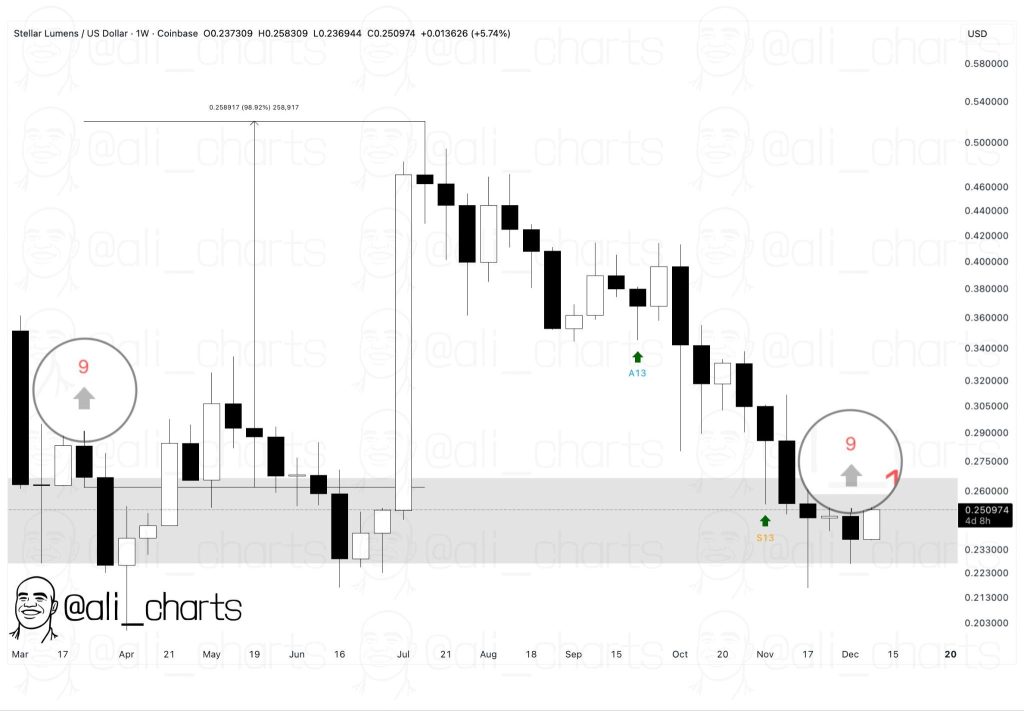
You can see how similar the structures look. The candles are pressing down into support, momentum is cooling off, and the indicator is indicating that selling pressure may be fading.
For traders who follow these signals, it’s hard not to notice how closely this moment mirrors the previous breakout.
XLM Tries to Find Its Footing After a Rough Few Weeks
Stellar hasn’t had the easiest ride lately. The XLM price slipped from above $0.35 down to the mid-$0.20s, following the wider weakness seen across many altcoins.
But despite the selling, XLM never broke below its major support area. That alone keeps things interesting, because this zone has acted as a launchpad more than once during the year.
Now that the TD Sequential has triggered again, the idea of a trend reversal is back on the table. It’s not a guarantee, no indicator ever is, but historically this specific setup has worked well for XLM when it happens in this region.
Read Also: Fed Cuts Rates 25bps – Crypto Market Reacts With Major New Deals and Token Moves
Will Stellar Repeat the 95% Rally?
That’s the big question. If the XLM price reacts the same way it did last time, the first level traders will watch is the $0.30 area, followed by the $0.35–$0.38 zone if momentum really picks up.
A move like that would look very similar to the previous rally where the same signal played a major role. For now, everything comes down to whether Stellar can hold above support and attract enough buyers to kick-start a turnaround.
The chart setup is there, the indicator is there, and the price is back in the same zone where the last big move began. The next few weeks will show whether the XLM price is ready for another run, or if this signal ends up being just another early spark.
Subscribe to our YouTube channel for daily crypto updates, market insights, and expert analysis.