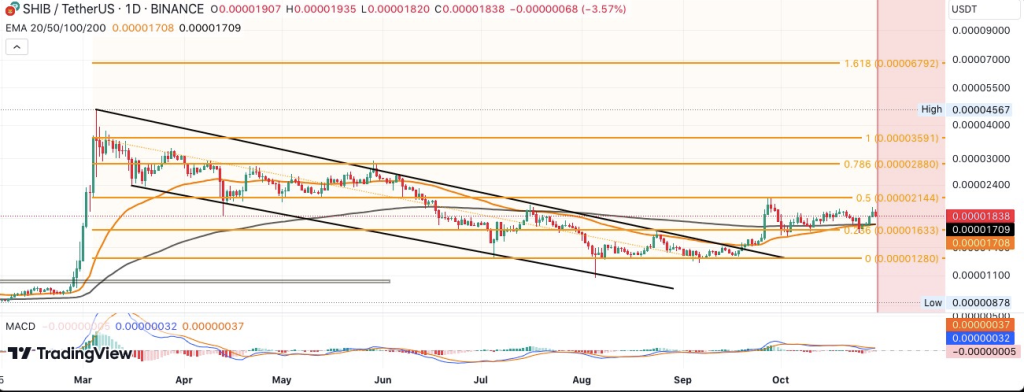
The price of Shiba Inu (SHIB) has experienced a near 20% climb from its weekly low, signaling growing bullish potential. Besides, recent technical indicators suggest an encouraging outlook for the token.
Coinpedia Market and top analyst Clifton Fx highlight key patterns and potential levels to watch, pointing to SHIB’s possible upward trajectory in the near term.
What you'll learn 👉
SHIB Eyes Golden Crossover and Double Bottom Formation
Per Coinpedia, Shiba Inu’s price movement shows a convergence between the 50 and 200-day SMAs, which could result in a golden crossover. This technical signal is often viewed as a bullish indicator.
Moreover, this suggests that SHIB might maintain upward momentum if the crossover is completed.

Further reinforcing this trend is the double bottom pattern identified at the 23.60% Fibonacci level ($0.00001633), which has bolstered the recent uptrend. The double bottom serves as a reversal signal, giving traders additional confidence in a continued rally for SHIB.
SHIB’s Fibonacci retracement levels also reveal further upside targets. Coinpedia analysts note that an immediate target lies at the 50% Fibonacci level ($0.00002144). Besides, SHIB has te potential to reach higher levels, around $0.00003591, if the bullish momentum continues.
Doge2014 raises 500K in days celebrating Dogecoin. Make potentially big profits and get in on exclusive airdrop!
Show more +Read also: Here’s Why Whales Are Manipulating Kaspa (KAS) Price
Broader Market Sentiment Supports Potential SHIB Gains
Broader market perception may also play a role in SHIB’s price performance. With increased positivity across the crypto sector, it potentially adds strength to the token’s gains.
As the crypto market recovers, SHIB’s price could benefit from renewed investor interest and broader support for meme-based coins.
Crypto analyst Clifton Fx recently observed a bullish flag formation on SHIB’s 3-day chart. According to Clifton Fx, an upside breakout from this formation could trigger a substantial rally, with gains estimated between 80% and 90%.
The flag formation is considered a continuation pattern, where the breakout generally aligns with the prior trend—in this case, a positive trend for SHIB.
Current Market Overview and SHIB’s Trading Volume
Based on data from CoinGecko, SHIB trades at $0.0000185 reflecting a minor 0.55% dip over the past day. It has risen by 4.29% across the week though.
The token’s daily trading volume stands at $599,154,024, highlighting market activity and continued investor engagement with SHIB despite shifts lately.
Follow us on X (Twitter), CoinMarketCap and Binance Square for more daily crypto updates.
Get all our future calls by joining our FREE Telegram group.
We recommend eToro
Wide range of assets: cryptocurrencies alongside other investment products such as stocks and ETFs.
Copy trading: allows users to copy the trades of leading traders, for free.
User-friendly: eToro’s web-based platform and mobile app are user-friendly and easy to navigate.


