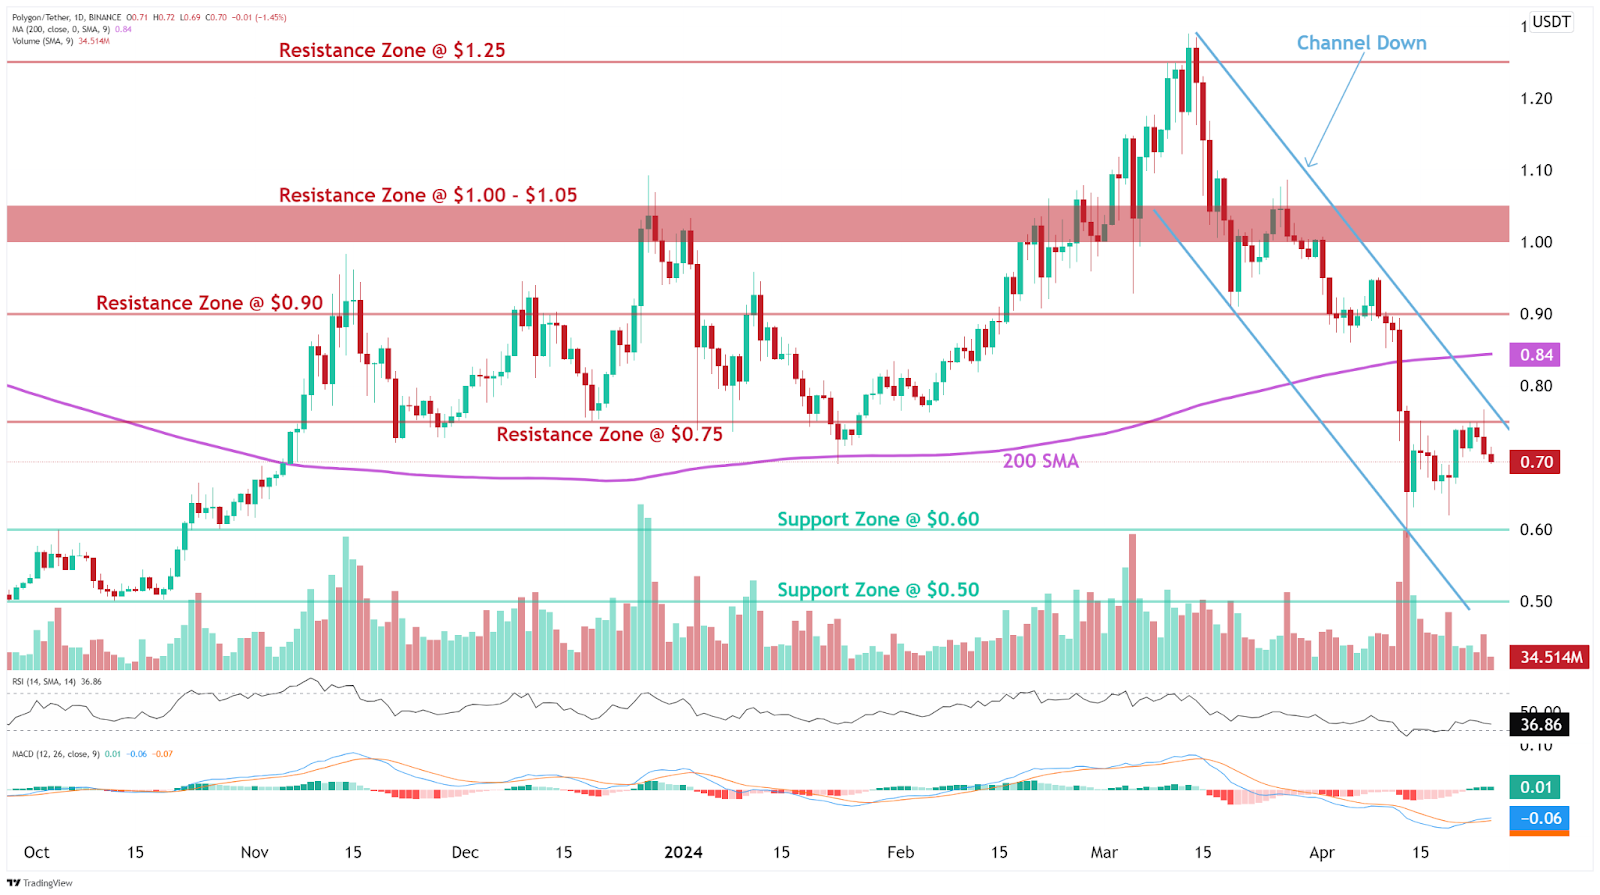
Polygon’s native cryptocurrency, MATIC, has been underperforming compared to other top cryptocurrencies, raising concerns among investors about its potential for recovery. According to altFINS’ technical analysis, MATIC’s price action presents a mixed outlook, with several key indicators suggesting a cautious approach might be warranted.
What you'll learn 👉
Lagging Behind Top Cryptocurrencies
One notable observation is that MATIC has underperformed in the current bull run. While most other top 20 cryptocurrencies have seen significant gains over the past year, MATIC is down 27% during the same period, positioning it as the “loser” of this bull cycle
An analysis of MATIC’s technical indicators reveals a mixed picture. Notably, the Relative Strength Index (RSI) currently stands at 51, indicating a neutral sentiment. However, the MACD (Moving Average Convergence Divergence) line is below the MACD signal line, suggesting a potential bearish trend in the short term.
Channel Down Pattern
Moreover, according to altFINS Trade setup, MATIC’s price is currently trading in a Channel Down pattern. Consequently, the price bounced off channel support at $0.60 and is now approaching a significant resistance area, where the channel resistance trendline and a horizontal resistance level at $0.75 converge.

Source: altFINS – Start using it today
For swing traders, this channel pattern presents an opportunity to initiate trades near channel support and exit near channel resistance. On the other hand, trend traders might choose to wait for a breakout from the channel before entering positions, as a breakout could potentially trigger a rapid price movement in the direction of the breakout.
Doge2014 raises 500K in days celebrating Dogecoin. Make potentially big profits and get in on exclusive airdrop!
Show more +Support and Resistance Levels
The analysis highlights crucial support and resistance levels for MATIC. The nearest support zone is identified at $0.60, followed by $0.50. Conversely, the nearest resistance zone is located at $0.75, which previously acted as a support level. Beyond that, resistance levels are projected at $0.90 and a range between $1.00 and $1.05.
Given the mixed technical signals and MATIC’s underperformance compared to other top cryptocurrencies, some investors might adopt a cautious approach and wait for clearer signs of a potential recovery. A decisive breakout from the Channel Down pattern, either to the upside or downside, could provide the necessary confirmation for traders and investors to position themselves accordingly.
Hunting for a small cap coin that could explode 10x? We’ve unveiled a few last week alone.
Get all our future calls by joining our FREE Telegram community.
We recommend eToro
Wide range of assets: cryptocurrencies alongside other investment products such as stocks and ETFs.
Copy trading: allows users to copy the trades of leading traders, for free.
User-friendly: eToro’s web-based platform and mobile app are user-friendly and easy to navigate.


