Solana price action has quietly turned into one of the few bright spots across the top 10 crypto assets. Over the past few sessions, SOL has managed to hold above the $140 level, even as most major altcoins struggled to build any notable price action. That solid strength has not gone unnoticed, especially after a fresh technical update from More Crypto Online showed a key Elliott Wave milestone on the SOL chart.
According to the analyst, Solana has now reached the ideal target for wave Y of (B), meaning the upside objective for the broader (B) wave structure has officially been met.
What you'll learn 👉
Solana Chart Analysis
Looking closely at the 30-minute SOL/USDT chart, price pushed into the $142–$143 area, which aligns with the 100% Fibonacci extension marked near $143.43. This zone acted as a clear reaction point, triggering a sharp rejection that sent SOL back toward the $139–$140 region.
That move fits cleanly into the Elliott Wave labeling shown on the chart. Wave Y of (B) completed right at resistance, followed by an immediate pullback. This tells us the market respected that level, confirming it as a short-term ceiling rather than a breakout zone.
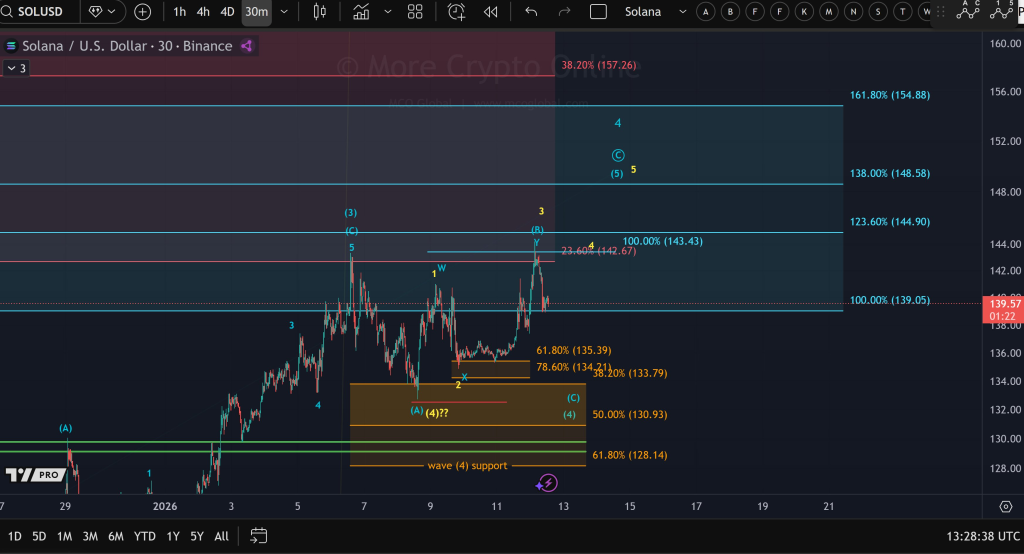
On the downside, the $138.50–$139 area now acts as the first important support. This level lines up with the lower boundary of the recent consolidation range and has already absorbed selling pressure multiple times. A deeper retracement could test the $135.30–$134.20 zone, which matches the 61.8% and 78.6% Fibonacci retracement levels marked on the chart.
Below that, the broader wave (4) support zone sits between $130.90 and $128.10. This area remains structurally important for maintaining the overall bullish sequence.
Solana Price: Key Resistance Levels to Watch
On the upside, Solana faces stacked resistance zones. The first sits at $143.40, where price already stalled. Above that, the next major resistance appears near $148.50, followed by a higher extension around $154.80. These levels represent Fibonacci extensions tied to the larger wave structure and would only come into play if the SOL price reclaims $143 with conviction.
Until then, upside attempts into the low $140s are likely to meet selling pressure.
Read also: XRP Price Looks “Lifeless” as Analyst Warns of a Drop
Short- to Mid-Term Solana Price Outlook
In the short term, the chart points toward consolidation or a corrective pullback rather than immediate continuation. With wave (B) objectives fulfilled, price may spend time digesting gains above $138 before the next directional move develops.
As long as SOL holds above the $134–$135 region, the broader bullish structure stays intact. A clean break below $130 would shift the outlook and open the door for a deeper correction. On the flip side, reclaiming $143 and holding above it would put $148 and $155 back on the radar for the mid-term view.
For now, Solana remains one of the strongest-looking large-cap charts, but price sits at a technical crossroads where patience matters more than chasing momentum.
Subscribe to our YouTube channel for daily crypto updates, market insights, and expert analysis.