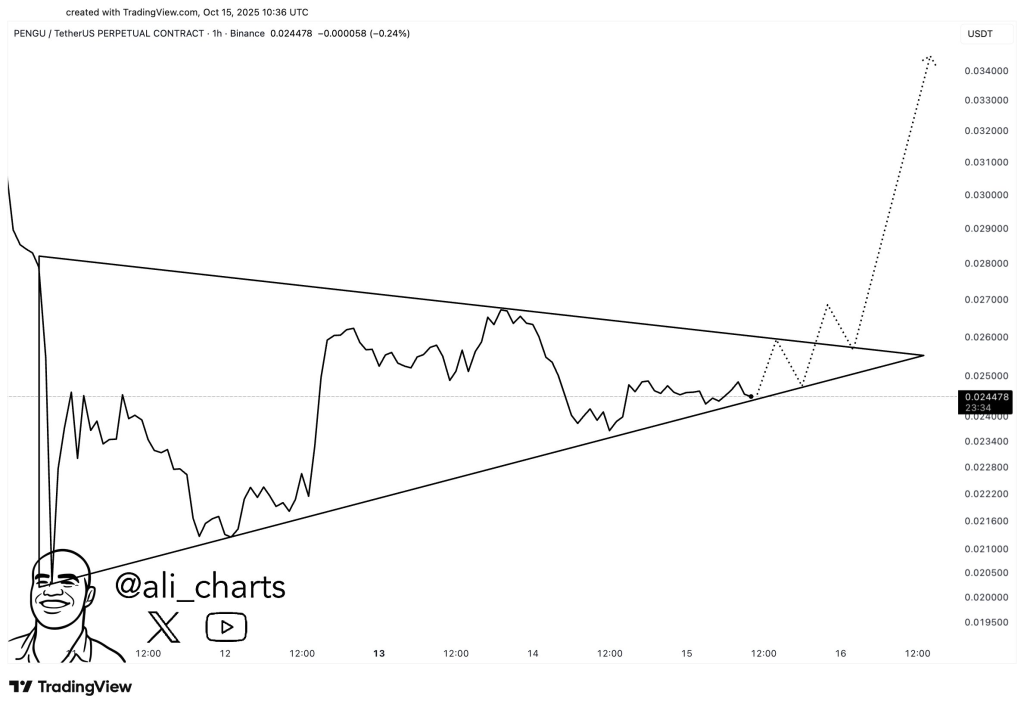
Pudgy Penguins (PENGU) token has been trading quietly inside a narrowing range after a steady downtrend since late July. A new chart from Ali has caught attention for a reason, it shows a triangle formation that looks close to resolving.
Ali’s analysis suggests that Pudgy Penguins price could regain strength once it pushes beyond $0.026. Why is that so? That level has acted as resistance several times, and a breakout above it could open the way toward the $0.035 area.
His chart illustrates this idea with dotted projections showing how the move might unfold if momentum picks up.
What you'll learn 👉
What Ali’s Chart Says About the Current Setup
The chart shows PENGU price consolidating between two converging trendlines, forming a symmetrical triangle. Price is moving within tighter swings, creating a pattern that often precedes a decisive move. Each rally attempt has been capped near resistance, while buyers have continued to defend higher lows.
Ali’s projection suggests that once the upper boundary breaks, the token could enter a recovery phase. The dotted lines on the chart show two possible paths one with a short pause before lifting higher, another with a direct breakout above resistance. Both hint that market tension is building as traders wait for confirmation.
Pudgy Penguins token currently trades near $0.024, right inside the final stretch of the pattern. The tightening action means that any breakout or rejection will likely happen soon, and the size of the move could reflect how long the price has been coiling.
PENGU Technical Signals From the Daily Timeframe
Data from Investing.com helps to clarify what is happening under the surface. Below is a summary of the main indicators and what they reveal about Pudgy Penguins price behavior:
| Name | Value | Action |
| RSI(14) | 39.079 | Shows weak momentum but room to recover |
| STOCH(9,6) | 64.892 | Suggests short-term buying pressure |
| MACD(12,26) | -0.002 | Signals bearish tone for now |
| ATR(14) | 0.0047 | Implies strong price swings ahead |
MACD remaining below zero confirms that the broader trend is not yet bullish, although it could flip if the price manages a sustained move above resistance.
ATR’s high reading shows that volatility remains elevated a sign that once a direction is chosen, the follow-through could be significant.
The Next PENGU Move Looks Near
The triangle structure and technical readings tell a similar story: the market is coiled up and waiting. A confirmed close above $0.026 could unlock new buying energy, potentially carrying PENGU price toward the $0.035 area as Ali’s projection outlines. Failure to break through might keep price trapped in the pattern for a while longer.
Read Also: Analysts Predict Hyperliquid (HYPE) Price Could Hit $100 by 2026 – Here’s Why the Numbers Make Sense
This moment could prove important for PENGU token traders, as the next decisive move might define its short-term trend. The setup forming around PENGU feels like calm before movement.
Subscribe to our YouTube channel for daily crypto updates, market insights, and expert analysis.