Worldcoin price has dipped by 20% after its initial rally this month. But when can the upward move continue? This chart gives a clue.
Crypto analyst Ali (@ali_charts) recently pointed out that WLD is consolidating inside a triangle pattern. According to him, a daily close above $1.42 could be the breakout trigger for the next big move.
What you'll learn 👉
WLD Price Is Stuck Between Support and Resistance
Looking at the chart shared by Ali, WLD has been forming a symmetrical triangle for several months now. This pattern is created by lower highs and higher lows, causing the price to squeeze between two trendlines. Right now, the WLD price is hovering around $1.10 after facing rejection near the top of the triangle, just below $1.42.
The chart shows that $1.42 is a major resistance level because it lines up with the 0.786 Fibonacci retracement level. This is a common area where price tends to react. On the lower end, the trendline support has held strong since February, with each dip being bought up by traders.
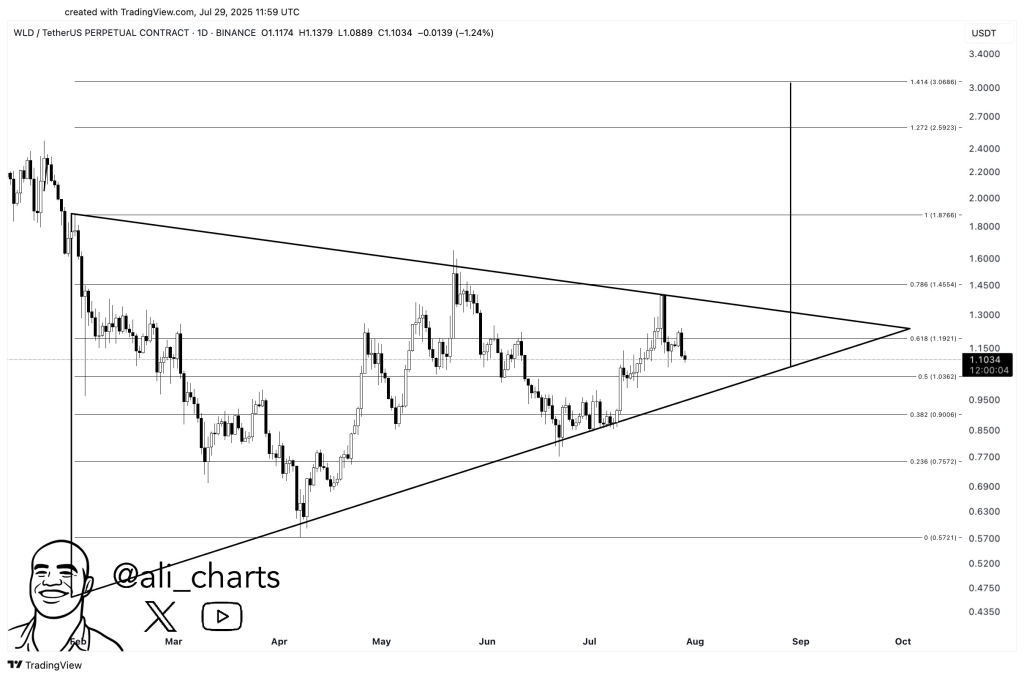
The range has been tightening, and WLD is now approaching the apex of the triangle. As this pattern gets closer to its end, a breakout becomes more likely. But the direction of that breakout will depend on whether WLD can finally close above resistance or fall below support.
Why the $1.42 Level Matters for Worldcoin
Ali highlights $1.42 as the key level to watch. A daily close above this level would mean WLD has broken out of the triangle to the upside. This could bring strong momentum, as traders and algorithms often react quickly to clear breakouts like this.
Above $1.42, the Fibonacci levels offer potential price targets. The $1.87 level would be the first major area of interest. After that, $2.59 and even $3.06 come into view. These levels line up with the 1.0, 1.272, and 1.414 extensions of the move from February’s low to March’s high.
But nothing is guaranteed. If WLD gets rejected again from $1.42 and breaks below the rising support line, the opposite could happen. A downside move toward $0.90 or even $0.75 could play out, based on the Fibonacci retracement levels.
The Triangle Pattern Is Running Out of Space
The chart shows that time is running out for WLD to stay inside the triangle. These kinds of patterns usually resolve by the time price reaches 70% to 80% of the way through. With the apex near early September, a breakout attempt could happen at any time now.
Read Also: ChatGPT and GROK Predict XRP Price in August
Ali’s analysis puts clear attention on the breakout level. His take is that a move above $1.42 could spark a bullish rally. This would confirm that buyers have taken back control, and it could turn $1.42 into a new support zone.
Subscribe to our YouTube channel for daily crypto updates, market insights, and expert analysis.