Pendle has emerged as one of the day’s top-performing tokens, recording a nearly 10% price increase and ranking among the top three gainers. At writing, the token is trading at $4.26 with a 24-hour trading volume surge of nearly 25%.
Top analyst Master Ananda outlines a technical chart setup on X that could potentially support a PENDLE price move toward $11 and $16 within the next 3-6 months. The tweet mentions the presence of a long-term double bottom and Adam & Eve pattern, supported by a confirmed resistance flip on May 9.
Read Also: Is It Too Late to Buy LTC? Litecoin Price Prediction
What you'll learn 👉
PENDLE Technical Patterns Support Bullish Continuation
The chart posted by Master Ananda indicates a well-defined technical structure with several historical resistance levels turning into support. The horizontal blue band, which has served as resistance across multiple months in 2024 and 2025, now acts as a confirmed support zone after the recent breakout. This zone lies near the current price of $4.15–$4.30.
Multiple bullish patterns have formed, including a double bottom stretching from January to March 2025, with the neckline breaking earlier this month. This formation suggests a potential reversal in long-term trend direction. Alongside this, the Adam & Eve pattern, comprising a sharp V-shaped bottom followed by a rounded one, is also visible. These formations are typically associated with trend shifts and have now completed their breakout above the neckline zone.
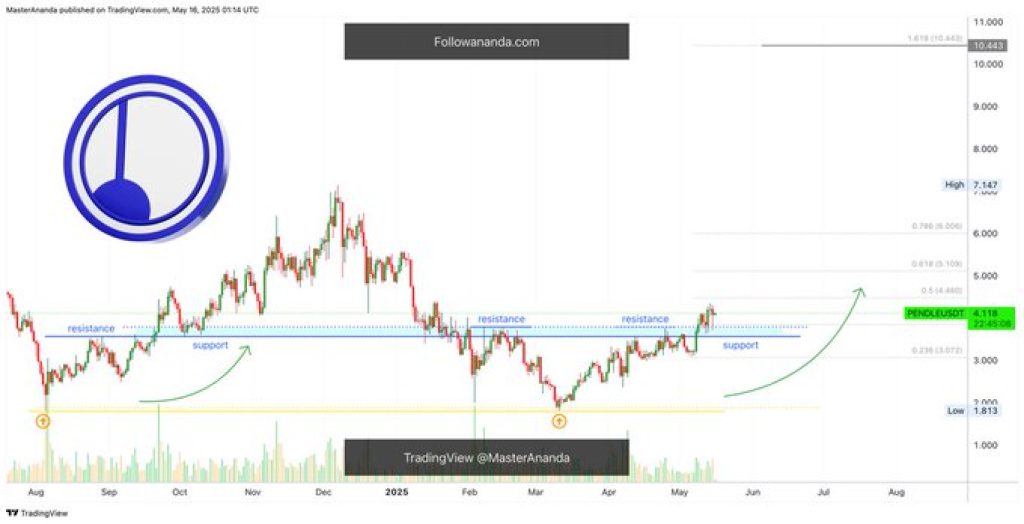
Furthermore, the chart includes Fibonacci retracement and extension levels that align with projected Pendle price targets. Key short-term resistance sits at the 0.618 and 0.786 Fibonacci levels, approximately at $5.25 and $6.50, respectively. Further extension levels place long-range targets at $11 and $16, assuming the bullish trend continues. These figures match those provided by Master Ananda in the tweet, reinforcing the forecast for continued upward movement.
Support near the $2.00-$2.50 range has proven reliable during recent downtrends and could serve as a safety zone in case of short-term pullbacks. Current price behavior is consistent with accumulation and breakout strategies often seen before strong rallies.
Read Also: Expert Predicts Cardano (ADA) Price Could Hit $1 Soon If This Happens..
PENDLE Breakout Timing and Market Behavior
The chart analysis suggests that Pendle price began its recovery from a March 11 low, moving gradually upward over the past two months. The May 9 breakout above resistance, followed by multiple days of successful retesting, marks a technical shift. Rising volume during the breakout phase and decreasing volume during pullbacks reflect healthy trading activity, further supporting bullish momentum.
The price structure now features higher highs and higher lows. This setup, paired with tested support, sets the stage for a potential consolidation period before further upside. If momentum holds, reaching the previously mentioned targets within the 3–6 month window is technically possible.
Analyst Perspective and Community Sentiment
Master Ananda’s tweet outlines a clear technical roadmap, backed by chart evidence. The suggestion that the market cycle is shifting is consistent with both volume behavior and price structure. Traders tracking Pendle price have shown increased interest as trading volume continues to rise, aligning with the growing sentiment across the broader market.
This setup reflects broader trends in crypto markets, where structural patterns and breakout confirmations play a key role in determining momentum. As long as price holds above the current support range, market conditions favor continued bullish behavior in the near term.
Read Also: This Chart Pattern Could Launch Toncoin (TON) Price to $5 – Here’s Why
Subscribe to our YouTube channel for daily crypto updates, market insights, and expert analysis.

We recommend eToro
Wide range of assets: cryptocurrencies alongside other investment products such as stocks and ETFs.
Copy trading: allows users to copy the trades of leading traders, for free.
User-friendly: eToro’s web-based platform and mobile app are user-friendly and easy to navigate.