
Toncoin is starting to turn heads as traders spot a chart setup that could lead to a major price move. A symmetrical triangle has formed on the daily chart, a pattern that usually shows the market is gearing up for a breakout.
Crypto expert Ali shared this observation on X, pointing out that Toncoin price is tightening within the triangle and could be ready for a 47% move once it breaks out. As the price gets closer to the tip of the triangle, traders are watching closely, expecting a burst of volatility to follow.
What you'll learn 👉
Symmetrical Triangle Signals Imminent Volatility For TON Price
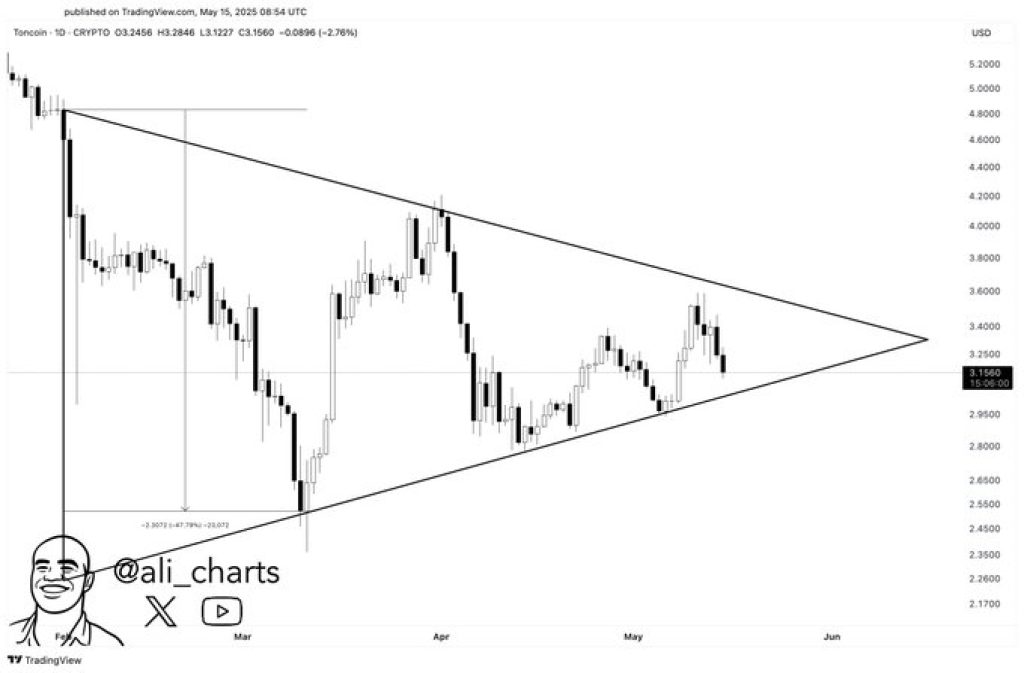
Toncoin has traded inside the symmetrical triangle pattern since March. The upper boundary is defined by a descending resistance trendline, while the lower boundary forms an ascending support trendline. The convergence of these trendlines indicates price compression, with the market preparing for a breakout in either direction.
The current trading price is around $3.15. This places Toncoin price near the midpoint of the triangle, although it is moving closer to the ascending support. The structure reflects a classic pattern where buyers and sellers are narrowing their price range, reducing volatility before a larger price swing.
Moreover, the immediate support level stands near $3.00, a zone that has served as a reaction point during previous corrections. A further support range between $2.85 and $2.90 is in place if the price breaks below the triangle.
On the upside, the key resistance lies between $3.55 and $3.60. This level represents the upper boundary of the pattern and is likely to be tested if buying pressure increases. A confirmed breakout above this resistance may open the door to price targets between $4.40 and $5.50.
Read Also: Indicator That Predicted Pepe Past Moves Is Now Flashing a Sell Signal
Potential TON Price Move Based on Measured Target
Ali’s tweet noted a possible 47% move from the breakout point. This aligns with the measured height of the triangle pattern, which spans from approximately $2.30 to $4.50. Applying this range to a potential breakout at $3.30 yields a projected target near $5.50.
Conversely, if Toncoin price breaks below the support, the technical target would be substantially lower. A decline toward the $1.10–$1.20 region remains a theoretical outcome but is less probable without broader market weakness.
Traders Eye Volume as Confirmation
As Toncoin approaches the apex of the triangle, volume trends will be closely monitored. A breakout accompanied by increasing volume would reinforce the move and help validate the direction. Until such confirmation occurs, TON price remains in consolidation with both bullish and bearish possibilities on the table.
Ali’s chart and analysis continue to circulate across crypto social platforms, with traders awaiting confirmation of the breakout direction before positioning.
Subscribe to our YouTube channel for daily crypto updates, market insights, and expert analysis.

We recommend eToro
Wide range of assets: cryptocurrencies alongside other investment products such as stocks and ETFs.
Copy trading: allows users to copy the trades of leading traders, for free.
User-friendly: eToro’s web-based platform and mobile app are user-friendly and easy to navigate.