Bitcoin price just gave chart watchers a familiar feeling, and it comes from a side-by-side comparison that is hard to ignore. Analyst Tryrex (@Tryrexcrypto) shared a TradingView chart that lines up April 2022 against January 2026, pointing to a pattern that starts the same way. Bitcoin makes a peak, Bitcoin price sells off hard, BTC settles into a box, then a breakout teases relief before the trend turns heavy again.
Tryrex calls it a simple question, and the chart makes it feel personal. Will history repeat itself for BTC price, or does this cycle break the rhyme.
Tryrex highlights the 2022 sequence first. Bitcoin hit an all-time high, then BTC price dropped roughly 45% over a few rough weeks. Price action later calmed down into a tight consolidation that lasted close to 4 months, with clear trendlines shaping the range.
That part matters because consolidations often look like healing. Price stops falling, candles overlap, and the market appears to be rebuilding structure. Tryrex suggests that phase set up the next move, even though the next move did not reward optimism.
BTC Price Fakeout Risk Shows Up When Breakouts Lack Follow Through
The 2022 panel shows a breakout attempt that became a fakeout. Bitcoin price pushed above the consolidation zone, then quickly rolled over. The chart marks that reversal as the point where the downtrend resumed, and the highlighted move shows a sharp drop of about 19% from the fakeout area.
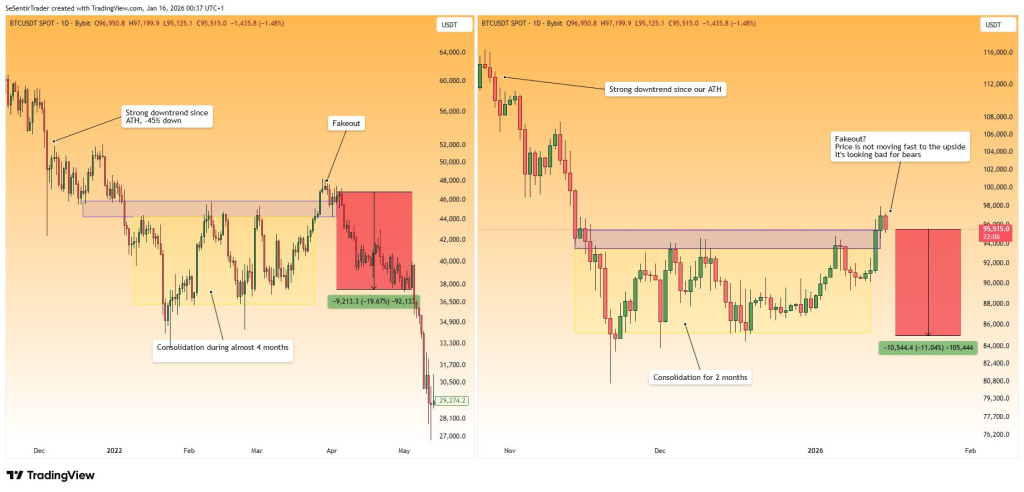
Tryrex uses that same lens on the 2026 panel. Bitcoin has already been in a strong downtrend since its recent peak, then BTC moved sideways for about 2 months. Price later pushed upward into a shaded resistance band, yet the note on the chart questions the move because upside progress looks slow.
That is the core fakeout concern in Tryrex’s post. Breakouts that do not accelerate can lose energy fast, especially when a prior resistance zone sits overhead.
Bitcoin Holding Near $95K Becomes A Short-Term Stress Point
Tryrex zooms in on $95K as the level that needs a quick recovery. The chart shows BTC price hovering around $95,515 on the right side, close to the area where the breakout attempt is being judged. A projected downside box on the same panel points toward the mid $80K region, roughly an 11% drop from that $95K zone.
Read Also: The One Problem That Could Haunt Kaspa (KAS) and Bitcoin Long Term
That projection does not guarantee anything, and Tryrex does not frame it as a certainty. The post reads like a warning about structure, speed, and follow-through. Bitcoin price either rebuilds strength above the breakout area, or the move risks looking like another short-lived push.
Curiosity now sits inside the next few candles, because Bitcoin often reveals its intentions after the excitement fades. Tryrex has laid out the map, and BTC price will show whether this is repetition or reinvention.
Subscribe to our YouTube channel for daily crypto updates, market insights, and expert analysis.