
After hitting a new 2024 yearly high of around $0.6 in late December, the XLM price entered a correction mode and is now trading just slightly above $0.4.
EGRAG CRYPTO posted a viral XLM chart and updated his Stellar price prediction, offering an intriguing analysis of the cryptocurrency’s potential trajectory.
What you'll learn 👉
XLM’s Complex Price Landscape
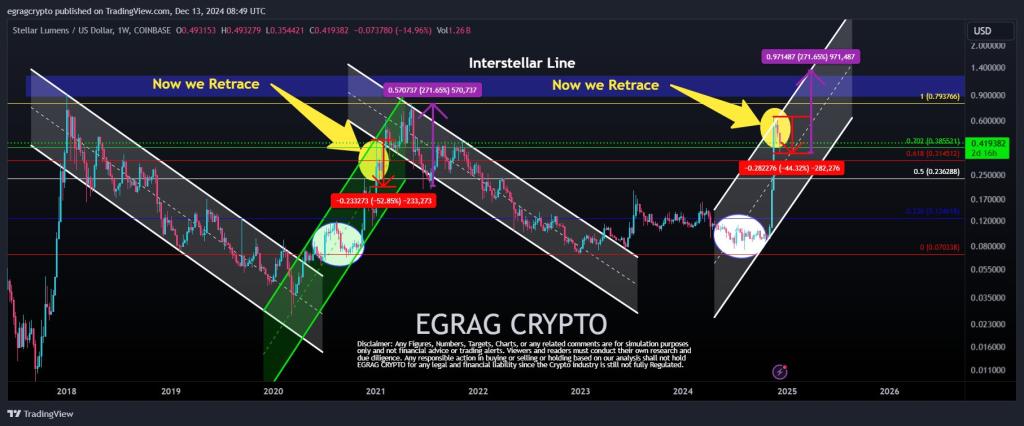
The Stellar chart reveals a nuanced picture of Stellar’s price movements, highlighting a long-term downtrend channel that has been in place since 2018. Within this overarching trend, XLM has experienced multiple periods of retracement and correction, creating a complex trading environment for investors.
A key focal point is the “Interstellar Line” situated around the $0.90 to $1 zone, which represents a critical resistance level. Breaking through this area could signal a significant bullish breakout for the cryptocurrency. The XLM chart meticulously identifies various support and resistance zones, including Fibonacci retracement levels that provide crucial insights into potential price movements.
XLM Price Forecast
Recent price action shows XLM underwent a remarkable 271.65% rise before experiencing a steep correction of approximately 44%. The price movement follows a wave-like structure reminiscent of Elliott Wave principles, currently positioned in what appears to be a corrective Wave 4 before a potential impulsive move.
Historical data provides valuable context for the current correction. Previous retracements have often been deep, ranging around 50% or more, indicating that the current pullback might be part of a “healthier” market reset. Critical support zones emerge at the 0.5 Fibonacci level near $0.23 and the 0.618 level around $0.34 – areas that have historically provided strong support and potential bounce opportunities.
The analysis presents two primary scenarios for XLM’s future movement. The first involves a breakthrough of the $0.90 to $1 resistance zone, signaling strong bullish momentum. The alternative scenario suggests a continued consolidation in the current corrective wave before launching into Wave 5, with potential price targets ranging from $1.2 to $3.
Two yellow markers on the chart specifically highlight “Retrace” phases, underscoring the current pullback as part of a broader market cycle. This approach combines technical precision with a nuanced understanding of market dynamics, acknowledging both the potential for short-term volatility and the possibility of a significant longer-term trend.
The analyst’s approach combines technical precision with a measured outlook, acknowledging both the potential for short-term volatility and the possibility of a longer-term bullish trend. While the current correction might challenge some investors, the underlying analysis suggests XLM could be preparing for a significant move in the coming months.
Read also: The XRP Price Won’t Hit $10 In 2025, But Experts Predict These Altcoins Can 10x
Subscribe to our YouTube channel for daily crypto updates, market insights, and expert analysis.

We recommend eToro
Wide range of assets: cryptocurrencies alongside other investment products such as stocks and ETFs.
Copy trading: allows users to copy the trades of leading traders, for free.
User-friendly: eToro’s web-based platform and mobile app are user-friendly and easy to navigate.