Chainlink ($LINK) has been stuck in a long downtrend since its 2021 peak near $53. The price has fallen more than 80% from that cycle high and has spent years moving inside a descending channel on the higher timeframes.
Now, one analyst believes that long period of weakness may actually be the setup for something much bigger.
Crypto Patel shared on X that a detailed 3-week chart analysis outlining why he thinks LINK could be preparing for a major breakout. His long-term targets? $26, $52, and even $100.
What you'll learn 👉
Here’s What The LINK Price Is Showing
According to the chart, LINK has been trading inside a descending channel for years. Every rally since 2021 has been capped by that falling resistance line.
However, the Chainlink price has now compressed into what Patel calls a higher timeframe demand zone between roughly $5.60 and $7.50. This area has acted as strong macro support.
The chart shows multiple higher lows forming inside this zone. Each time price dipped into support, selling pressure was absorbed. That kind of structure often suggests accumulation rather than panic selling.
Right now, the LINK price is trading near range equilibrium around the $8 level, sitting just above that long-term demand block.
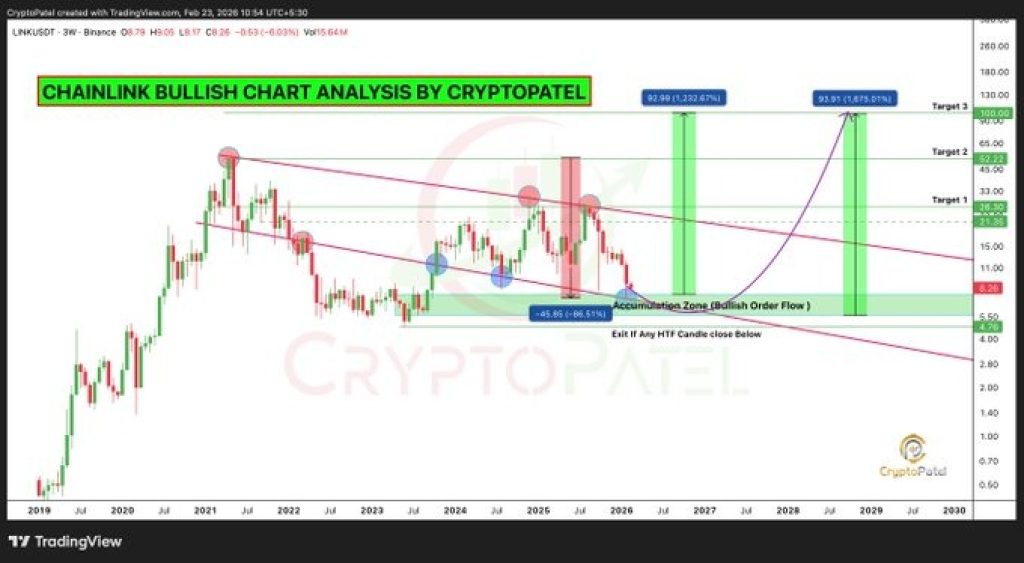
However, one key point in the analysis is volatility contraction. On the 3-week timeframe, price swings have tightened significantly. Large compressions like this often lead to expansion moves.
Above the market, major liquidity levels sit near $26, $52, and $100. These levels align with prior highs and psychological resistance zones.
The analyst also notes similarities between the current structure and previous cycle compressions before strong breakouts. That fractal comparison is part of why the upside targets look so aggressive.
However, there is a clear confirmation level. For the bullish thesis to gain strength, LINK needs to break and hold above the descending trendline resistance on a 3-week close. A breakout above the range high would signal that the structure has shifted.
The Invalidation Level For Chainlink
Every bullish setup needs a line in the sand.
In this case, the structure remains valid as long as the LINK price holds above $4.76 on a 3-week candle close. A breakdown below that level would signal structural failure and open the door to further downside.
That makes this a high-timeframe setup built on patience. It is not about short-term trading. It is about positioning during a long consolidation phase and waiting for confirmation.
Read Also: Smart Money Is Loading Bittensor (TAO): Here’s the Blockchain Proof
Is $100 Really Possible?
From current levels, a move to $100 would represent a massive percentage gain. That is why the prediction sounds shocking.
But the argument is based on structure, not hype. LINK has corrected deeply, built a base for years, and is sitting at macro support inside a long compression pattern.
If the descending channel breaks and momentum returns, the next major liquidity clusters are clearly visible on the chart.
For now, the LINK price remains inside its multi-year range. Whether this turns into a historic breakout or another failed rally depends on one thing: can price finally escape the channel that has capped it since 2021?
Subscribe to our YouTube channel for daily crypto updates, market insights, and expert analysis.