Chainlink’s (LINK) market-value-to-realized-value (MVRV) ratio has fallen below -16%, a level historically associated with major rebounds.
Crypto analyst Ali (@ali_charts) pointed out that previous instances of MVRV dipping under this threshold led to LINK’s price gains ranging from 25% to 312%. Current market indicators suggest that the asset is at a potential turning point, with technical factors aligning for a possible upward move.
#Chainlink $LINK has historically rebounded when the MVRV drops below -16%, with past gains of 312%, 64%, 61%, 25%, and 52%.
— Ali (@ali_charts) February 18, 2025
Right now, MVRV sits at -16.3%, signaling another rebound on the horizon! pic.twitter.com/3pJ0tlsjgY
Chainlink (LINK) is showing signs of finding its footing around $18 after December’s sharp pullback from the $30 level.
While the series of lower highs and lows points to sustained bearish pressure, LINK’s proximity to the lower Bollinger Band suggests the selling might be running out of steam. The token has been moving within a tight daily range of $17.44 to $18.13, potentially setting up for its next move.
What you'll learn 👉
LINK Technical Indicators Suggest Reversal
Bollinger Bands indicate LINK is trading above the lower boundary of $15.974, often a signal of oversold conditions. If the price breaks below this level, further downside could follow.
Conversely, a bounce from this zone could drive LINK toward the middle band at $19.517 or higher. The narrowing bands suggest that a breakout may be imminent.
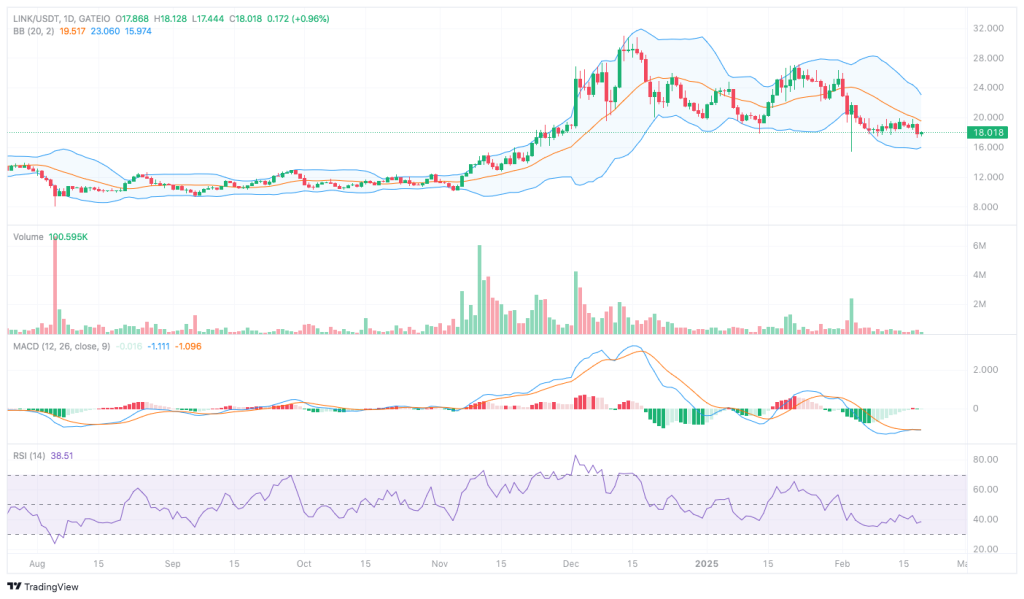
Momentum indicators also point to a possible shift. The MACD histogram is recovering from a bearish phase, with the MACD line attempting a crossover above the signal line. While still below zero, a confirmed crossover could indicate a bullish reversal.
Meanwhile, the RSI stands at 38.51, showing weak bullish momentum but not yet oversold. A drop below 30 would indicate stronger buying interest at lower levels.
Read also: How Many Litecoin (LTC) Tokens You Need to Become a Millionaire by 2026?
Volume Trends and Chainlink’s Market Sentiment
Trading volume has declined since LINK’s November-December rally, reflecting reduced selling pressure. A price rebound would require a corresponding volume surge to confirm strong buying activity. If LINK rebounds from its support zone, increasing volume would be a key factor in sustaining a recovery.
LINK faces critical support at $16.00-$16.50. Furthermore, if the downturn persists, a stronger backing is around $12.00 to $13.00. The 20-day SMA and $19.50-$20.00 represent resistance on the upward. While breaking above $25.00 would signal a trend reversal, a breach above $22.00–$23.00 could support bullish optimism.
Market participants are watching LINK’s price action as it approaches key technical levels. With historical MVRV data hinting at a rebound and technical indicators stabilizing the asset’s next move could determine its trajectory in the coming weeks.
Follow us on X (Twitter), CoinMarketCap and Binance Square for more daily crypto updates.
Get all our future calls by joining our FREE Telegram group.

We recommend eToro
Wide range of assets: cryptocurrencies alongside other investment products such as stocks and ETFs.
Copy trading: allows users to copy the trades of leading traders, for free.
User-friendly: eToro’s web-based platform and mobile app are user-friendly and easy to navigate.