
Bitcoin price is hovering near $63K after recently touching $60K. That level alone would not turn heads in an average cycle. What makes this moment different is where BTC sits relative to its 2 year moving average.
Crypto analyst Crypto Patel highlighted this exact setup in a recent post. He pointed out that Bitcoin is trading below the 2 year MA and under a key $86K green line that has historically marked accumulation territory. His broader thesis is simple. Every time BTC traded below this long term average, a major bull run followed.
The 2 year moving average acts as a long term cycle gauge for Bitcoin price. When BTC drops below it, the market typically enters a deep correction phase. Those phases have not lasted forever.
Crypto Patel referenced prior cycles to frame the argument. In 2015, Bitcoin traded below the 2 year MA before rallying roughly 120x into the next major peak. In 2019, BTC again dipped under that threshold and later delivered around 21x to the red zone peak. The 2022 cycle showed a more moderate 7x expansion after the same setup.
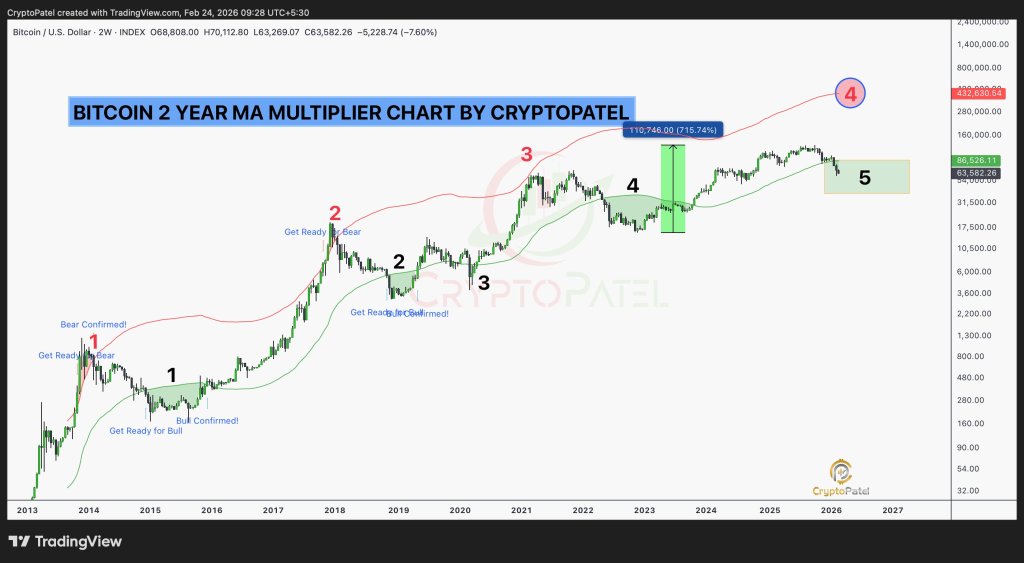
Now, in 2026, Bitcoin sits below that same long-term marker again. The pattern has reappeared. That does not guarantee the same magnitude of returns. It does place BTC price in a zone that historically preceded powerful upward phases.
The $86K Green Line And The $430K Red Zone Define The Framework
Crypto Patel uses two key reference levels. The green line at $86K marks what he describes as the smart money accumulation zone. Bitcoin currently trades below that level, which positions BTC price inside what he considers a discounted region.
The red line at $430K represents a projected distribution zone. Past cycles moved from below the 2 year MA toward similar upper cycle targets. That red zone serves as a long-term objective rather than a short-term forecast.
This framework divides the cycle into accumulation and distribution phases. When Bitcoin price trades under the 2 year MA and below the green threshold, history shows that long term buyers stepped in. Once BTC moves far above that structure, profit-taking tends to increase.
Read Also: Kaspa Has No Bottom Yet: Here’s How Low KAS Price Can Go
Bitcoin does not move in isolation. Broader macro conditions influence how fast or how far BTC price can travel. ETF flows, liquidity conditions, and global risk appetite all play a role in shaping the trajectory.
Crypto Patel’s analysis focuses on structural positioning rather than daily volatility. Dollar cost averaging below the 2 year MA has historically offered strong risk adjusted outcomes. That strategy assumes patience and a multi-year horizon.
Subscribe to our YouTube channel for daily crypto updates, market insights, and expert analysis.