Silver is back in motion. The XAG price jumped close to 4% and is hovering around $90.70 as money rotates back into defensive assets. A fresh 10% tariff hike from the United States has rattled markets, keeping nerves tight.
However, traders are watching the US-Iran talks in Geneva, where the outcome is far from certain. Add to that growing bets that the Federal Reserve may ease rates in the months ahead, which has kept the Dollar from pushing higher.
Lower yields and geopolitical tension are combining to keep silver bid for now. Now the focus shifts to the chart.
Here’s What The Silver Chart Is Showing
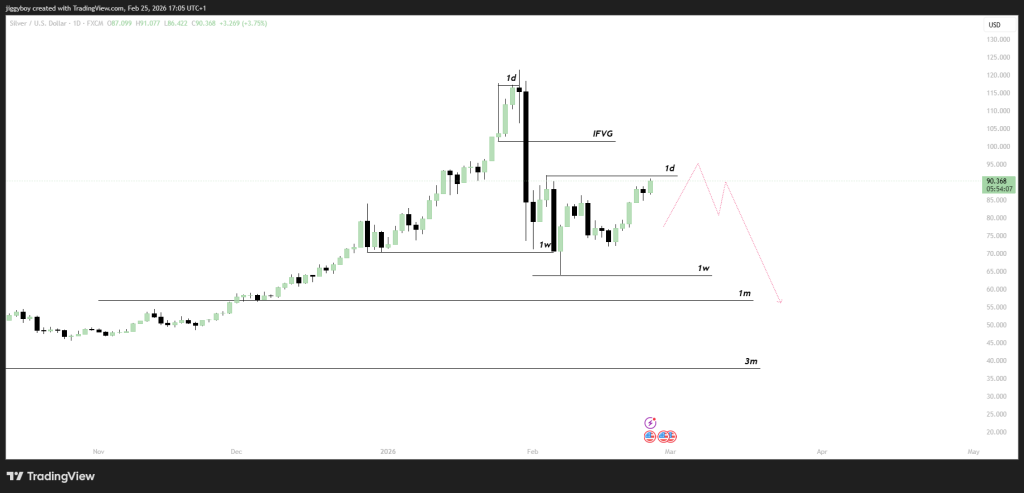
The recent price structure shows how aggressive the rally was earlier this year. The Silver price ran hard into early February before printing a sharp daily rejection candle that marked a clear pause in momentum.
That rejection led to a fast drop into a weekly support zone around the mid-$70s, where buyers stepped in quickly.
Since then, price has been stabilizing and forming higher lows, working its way back toward the $90–$95 area. This zone is important because it previously acted as a ceiling. The last time silver reached it, sellers overwhelmed buyers and forced a deep pullback.
Right now, the Silver price is sitting just under that barrier again. If this level gives way, it would mark a structural shift and signal that buyers have regained control. If it holds, the rally risks stalling in the same area that triggered the last correction.
Step back and the broader picture is still constructive. The run from late 2025 into early 2026 was sharp and almost vertical, and markets don’t hold that kind of pace forever without cooling off.
What matters now is how this pause ends, does it turn into the next leg higher, or does it start to unwind?
Below current price, the weekly support near the low-$70s remains the first serious line of defense. That level absorbed heavy selling during the last drop.
If the Silver price drops back to that level and buyers don’t step in, the floor gets much lower. The next meaningful area sits in the mid-$50s on the monthly chart. A fall like that would drag $60 into play quickly, and $70 would no longer look like a cushion but a level already lost.
On the other side, a decisive daily close above $95 would change the conversation. Clearing that zone removes the most visible overhead supply and exposes the next expansion area around $110.
If global tensions flare up further or the Federal Reserve makes it clear that rate cuts are coming, silver could catch another strong wave of buying. In that kind of backdrop, a move toward $120–$130 over the next few months would not be out of reach.
Read Also: How $19M In $PUMP Turned Into a $10M Disaster for a Private Investor
The Silver Price Levels That Matter Now
This week is critical because silver is pressing directly against resistance. If silver can punch through $95 and actually stay there, the tone changes quickly.
That would clear out a major ceiling and put $110 on the radar, with $130 no longer sounding unrealistic if momentum keeps building.
But if the Silver price keeps getting rejected and drifts back under $85, the air starts to thin. A move toward $75 would make sense in that case. Lose $70 with conviction, and the conversation shifts to a much deeper pullback, with $60 coming into view.
Right now, silver is caught between strong safe-haven interest and a stubborn resistance zone overhead. News on tariffs, global tensions, and the Federal Reserve will likely steer the next move.
Price action looks compressed right now, as if it’s waiting for a trigger. The next few sessions should show whether silver is building energy for a push toward $130, or starting to roll over toward $70 instead.
Subscribe to our YouTube channel for daily crypto updates, market insights, and expert analysis.