A suddendrop in a major token often feels like watching a strong swimmer being pulled underwater by an unexpected current. The chart looks stable one week, then a sharp wick plunges down the screen, transforming curiosity into a quest for clarity. A similar moment is occurring with SUI, and many holders want to understand the short-term outlook.
A technical update from Eye Zen Hour (@eyezenhour on X) offers a clearer map of what may come next, and the weekly chart tells a story that is easier to grasp than it initially appears.
What you'll learn 👉
SUI is Positioned Within a Key Regression Trend While Testing a Critical Level
A glance at the weekly chart reveals that SUI is drifting within a wide regression trend that has guided most of its price action. The token is currently near $1.55, close to the weekly hypertrend line around $1.53. This positioning is noteworthy because the hypertrend has repeatedly acted as a support level, catching SUI whenever volatility spikes.
According to Eye Zen Hour, the macro uptrend channel above this region remains intact, and the price continues to respect its broader structure, despite a slowdown in momentum. The long wick from October, which dropped from $2.80 to $0.56, tells another story. These ultra-wide wicks tend to behave like stretched elastic bands, often returning to the midpoint, which in this case is around $1.68. SUI has already touched that zone, aligning with the wick-fill mechanics without necessitating a full ascent back to the wick high.
The chart illustrates this clearly: the red candle drops toward the lower channel, touches the hypertrend, and then hovers above it. This suggests that this area may define whether short-term strength emerges or further weakness follows.
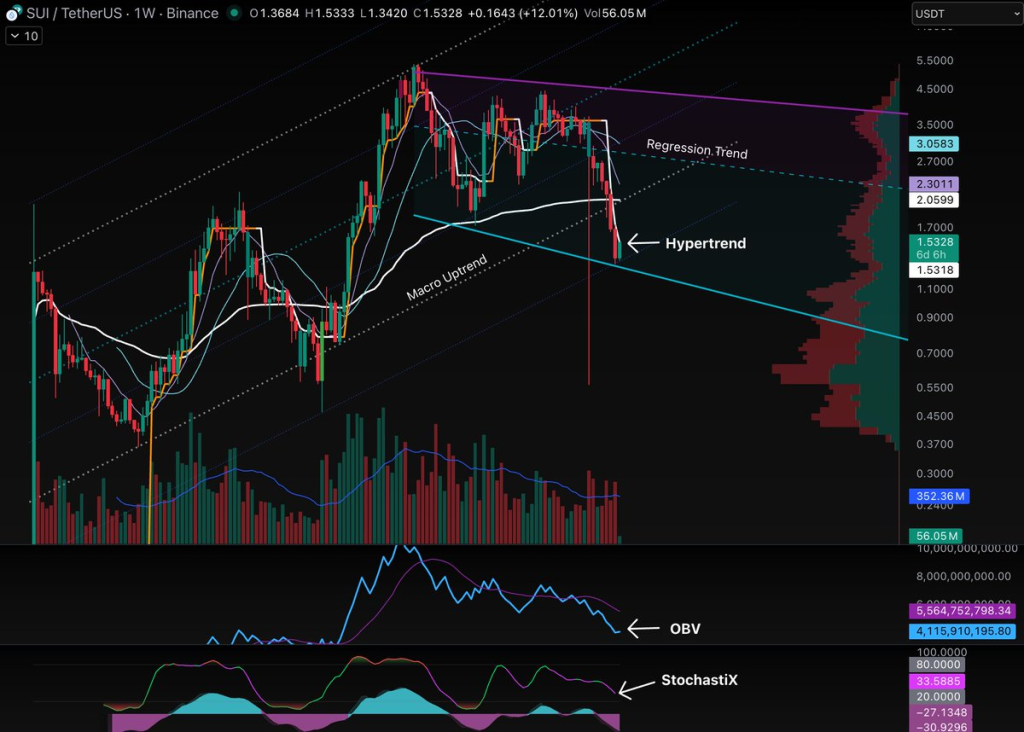
SUI’s Momentum Indicators Indicate Short-Term Exhaustion
The technical indicators convey their own message. The weekly On-Balance Volume (OBV) has drifted significantly below its moving average, signaling that buyers have retreated while sellers dominate volume flow. The StochastiX reading is also nearing its oversold boundary, which often appears near turning points when momentum becomes stretched.
Volume has started low at the beginning of the current weekly candle. While a weak start does not define the entire week, it indicates that buyers have not yet stepped in strongly. This combination places SUI in a delicate position, sitting precisely on a technical support region while momentum indicators suggest exhaustion.
Eye Zen Hour emphasized that a weekly close above $1.53 with meaningful volume might mark a shift toward short-term strength. The chart supports this idea: the hypertrend line acts like a hinge, and how SUI reacts around it could determine whether the next move develops into a rebound or a slide deeper into the lower trend channel.
Key Reclaim Levels for Traders Monitoring Immediate Structure
The daily chart presents clearer checkpoints. SUI is currently trading above its daily hypertrend and pressing against the 9 SMA (Simple Moving Average). A break above that resistance would expose the $1.79 area, which aligns with the 20 SMA.
The daily StochastiX is in oversold territory, while the daily OBV shows signs of flattening, indicating that selling pressure may be slowing. If the price rises from $1.53 to $1.68, the first reclaim zone identified by Eye Zen Hour, momentum might begin shifting into a healthier structure.
The critical zones to monitor are $1.53, $1.68, and $1.79. These levels are not predictions; rather, they are mechanical points visible on the chart that traders often use as benchmarks to evaluate the strength or weakness of a recovery. The mid-term outlook remains tied to $2; a move above that region would confirm a stronger structure, according to the analysis.
Weekly Structure Points Toward Scenario-Based Outcomes
The weekly hypertrend shows the central question: the price is hovering at a point where a small push can shift sentiment. A close above the hypertrend with rising volume would signal that momentum may shift upward in the short term, while a close below it suggests that the lower channel could pull the price towards deeper liquidity pockets.
The volume profile on the right side of the chart shows a thicker liquidity zone near $1.30 to $1.50, reinforcing the notion that the market has treated this area as an accumulation zone. If the price maintains this level, movement from $1.55 to $1.68 becomes a natural trajectory. Conversely, if it breaks down, the lighter liquidity zones may create space for sharper downward movements.
Read Also: Bitcoin Stabilizes but XRP, PEPE, and SUI Deliver the Real Monday Moves
Short-Term Outlook for SUI Moving Forward
The short-term direction hinges on whether SUI can maintain strength above the weekly hypertrend at $1.53. A reclaim of $1.68 introduces the potential for a gradual climb toward $1.79. A robust push above these levels would shift focus toward the mid-term marker at $2, identified by Eye Zen Hour as confirmation of a healthier structure.
The chart reveals a token positioned on a technical hinge: momentum is weak yet nearing exhaustion, the price is near major support, and volume remains subdued. These mixed signals create a landscape where small movements can trigger larger reactions.
The next few candles are particularly significant, as they may determine whether this region becomes a launchpad or a descent into the lower trend channel.
Subscribe to our YouTube channel for daily crypto updates, market insights, and expert analysis.