First glance at the chart feels familiar. Price sits near a long-running channel low that previously launched SUI into a massive rally. Traders watching SUI may find that pattern hard to ignore.
This piece walks through why that channel matters for SUI price. The post came from Sui Intern, who referenced the structure using a chart created by Ali, and that combination makes the setup easier to understand.
What you'll learn 👉
SUI Price and the Channel Low That Mattered
This chart from Ali draws a clear parallel to a prior setup. Price touched a channel low before a 1,060% run. Current price sits close to channel support again after a drop of about 40% over the last month.
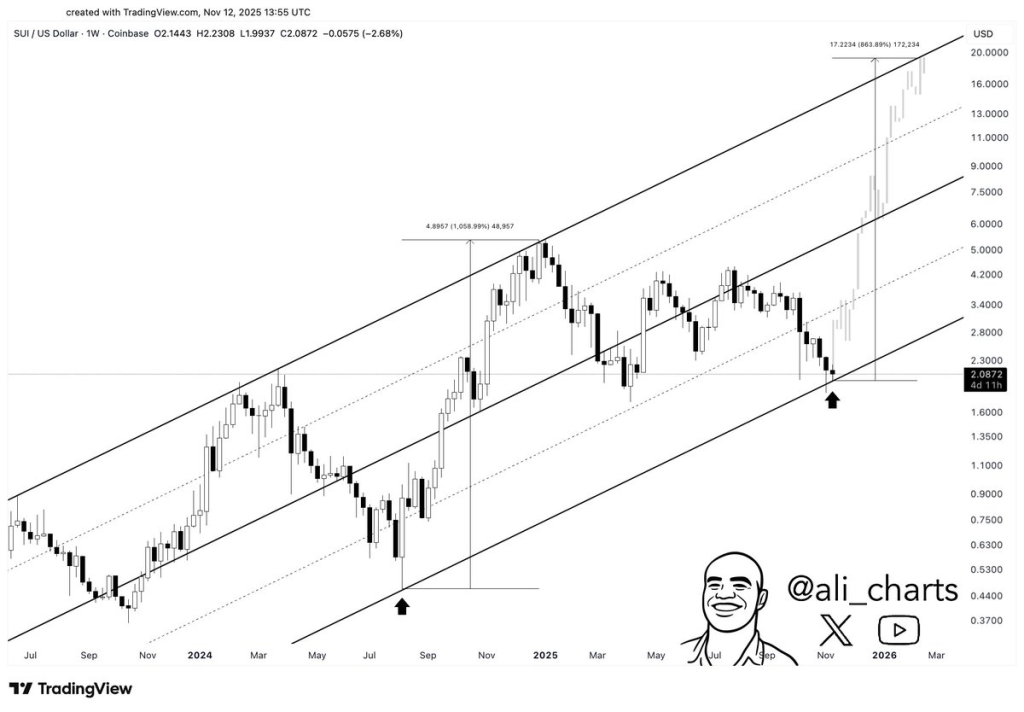
Trading around $1.81, SUI looks like it is testing the same structure that produced the big move before. Sui Intern posted a tweet pointing out this pattern and suggested that, if structure repeats, a path up to $20 could be possible.
That idea rests on price respecting channel support and then catching momentum as it did previously.
That move set a template by which analysts compare the current structure; however, chart patterns repeat sometimes and fail other times. This piece aims to explain why the setup looks familiar rather than promise outcomes.
Sui Token Technical Picture From Ali’s Chart
This image from Ali shows weekly candles inside a rising parallel channel. Each time price returned to the lower band, buyers stepped in and pushed price higher. Previous touch points came with strong weekly momentum and long green candles.
The current weekly candle sits near the lower band and a horizontal support line. That convergence creates a simple risk versus reward scenario for those who read charts. Sui Intern referenced the prior explosive move as context. Ali’s drawing gives a visual explanation of why that prior low mattered and why a repeat could be meaningful for SUI token.
Sui Price: What the Weekly Indicators Say
Here is what the weekly indicators from the investing .com says about the present price action of SUI
| Name | Value | Action |
| RSI(14) | 36.132 | RSI sits below neutral area and shows limited bullish momentum. This suggests strength has cooled while price nears support. |
| STOCH(9,6) | 50.577 | Stochastic sits near middle band and offers no clear signal. This implies oscillators are waiting for a decisive swing before signaling a direction. |
| MACD(12,26) | -0.348 | MACD is below zero and signal line area. This reflects that momentum favors sellers at present and that convergence or a cross would be needed for bullish confirmation. |
| ADX(14) | 33.407 | ADX above 25 shows trend strength. Current trend points downward while price tests support which means trend remains meaningful even during pullback. |
| Ultimate Oscillator | 52.479 | Ultimate Oscillator sits above midpoint and hints at some buying pressure. This could signal early accumulation near support even while other indicators look cautious. |
How Each Indicator Lines Up with Price Action
The weekly indicators show mixed momentum for SUI. RSI near 36 signals weak momentum but not true oversold conditions, which fits the current channel test where sellers pushed price lower without breaking the structure. Stochastic also sits in the middle zone, showing no strong directional bias and reflecting the market’s hesitation as price moves toward support.
Momentum tools lean bearish but show signs worth watching. MACD remains negative, confirming the pullback and explaining why price needed to cool off after recent strength. However, a shrinking negative histogram or a cross upward would signal a shift in momentum. ADX above 33 shows the trend is strong and still favors sellers, meaning a breakdown below the channel low could extend losses unless buyers step in and weaken the trend.
Some subtle bullish pressure is still visible. The Ultimate Oscillator holding above 50 suggests short-term buying interest as price interacts with long-term support.
Read Also: The Real Catalysts Behind Kaspa (KAS) Potential Run to $4
What happens at the channel low now becomes key. A strong weekly close back above the mid-channel would show buyers regaining control, while a failure at support opens the door to further downside. Clearer signs of a reversal would appear if oscillators turn higher as MACD’s downside momentum begins to fade.
Subscribe to our YouTube channel for daily crypto updates, market insights, and expert analysis.