The SUI price has seen an18% surge over the past four days, and some analysts believe this is just the beginning. The chart is starting to show signs that a bigger move may be on the horizon. One technical analyst, Bitcoinsensus, shared an analysis using Elliott Wave Theory that caught our attention. According to him, SUI has likely completed its Wave (1) and is currently wrapping up a Wave (2) correction.
In simple terms, Elliott Wave Theory maps out price moves in five key waves during a trend. If SUI has indeed completed the first wave and is nearing the end of a correction, the next wave—called Wave (3)—could be a powerful rally. This third wave is usually the strongest, and based on standard Elliott calculations, it could reach between $7.50 and $8.00.
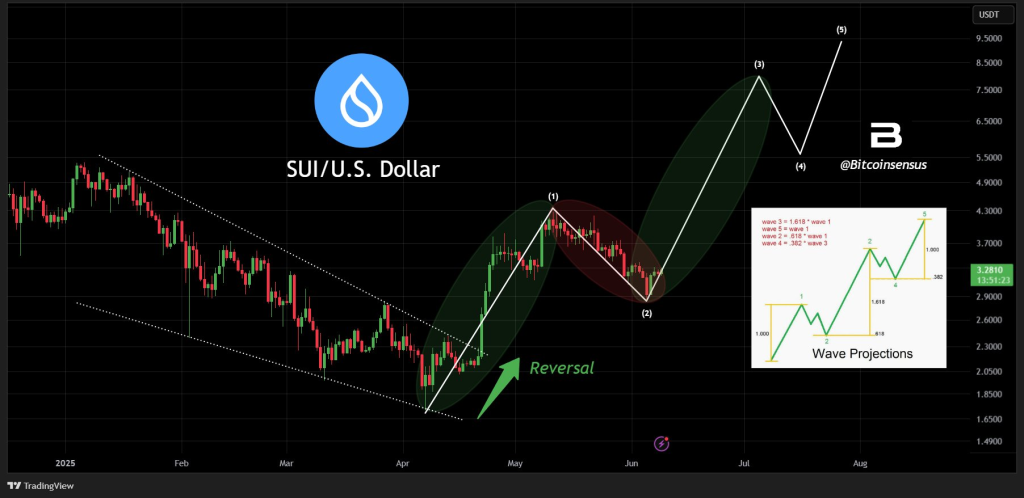
Bitcoinsensus also pointed out that the breakout from a descending wedge pattern confirms a daily trend reversal for SUI, which gives more weight to the bullish case.
What you'll learn 👉
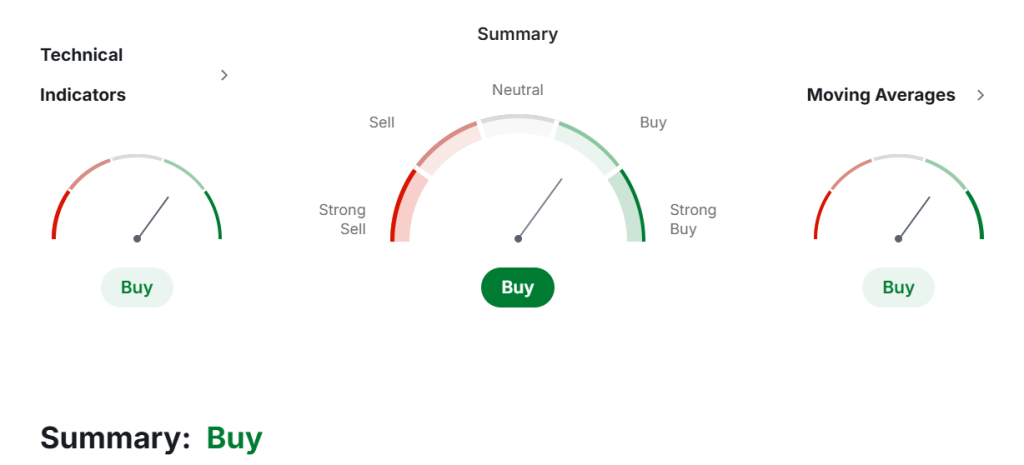
What the SUI Indicators Are Saying
To cross-check this technical setup, we looked into Investing.com to see what key indicators are saying about the SUI price.
Right now, the Relative Strength Index (RSI) is sitting at around 58.89, which means SUI is gaining momentum but isn’t yet overbought. It suggests buying pressure is healthy and there’s still room to grow.
The Stochastic Oscillator, which often flags possible reversals, is at 48.83. This is a neutral zone, signaling that the market isn’t overheated and there’s balance between buyers and sellers.
The MACD, which tracks momentum, is currently in positive territory at 0.041. This supports a “buy” signal and aligns with the recent uptick in price.
The Average Directional Index (ADX) stands at 14.31, suggesting that while the trend is forming, it’s not strongly established yet. However, since price has recently broken out of a wedge pattern, that might change quickly if buying continues.
Then there’s the Average True Range (ATR), which is at 0.0422, pointing to high volatility. For traders, this means big swings could be on the way.
Lastly, the Ultimate Oscillator is at 59.39, which is a slight “buy” signal. It indicates growing bullish momentum across short, medium, and long-term price periods.
What Moving Averages Are Saying About SUI Price
All key moving averages are flashing green. The 50-day Simple Moving Average (SMA) is at $3.33, and the Exponential Moving Average (EMA) is slightly higher at $3.35. Both point to continued upside.
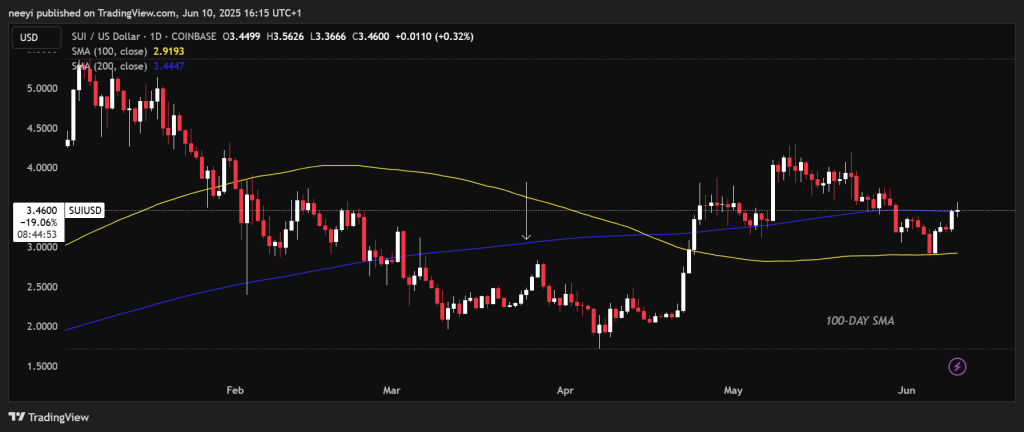
For the 100-day MA, the SMA is at $3.27 and EMA at $3.30—again, both suggest SUI is trending up and attracting steady interest.
Even the long-term 200-day MA supports the bullish case, with the SMA at $3.24 and the EMA at $3.29. These readings tell us that the broader market structure for SUI is firming up.
Read Also: Why the SEC Case Was Just the Beginning for XRP (Real Growth Starts Now)
Verdict on SUI Price: A Rally to $8 Is On the Table
SUI is showing strong signs of an uptrend, both in price action and technical indicators. With confirmation from Elliott Wave theory, a healthy breakout, and several buy signals across RSI, MACD, and moving averages, the next leg up could indeed target the $7.50 to $8.00 range.
If momentum continues and Bitcoin holds steady, SUI may soon complete its Wave (2) pullback and blast off into Wave (3). A 2x move from current levels is looking more and more realistic.
Subscribe to our YouTube channel for daily crypto updates, market insights, and expert analysis.

We recommend eToro
Wide range of assets: cryptocurrencies alongside other investment products such as stocks and ETFs.
Copy trading: allows users to copy the trades of leading traders, for free.
User-friendly: eToro’s web-based platform and mobile app are user-friendly and easy to navigate.