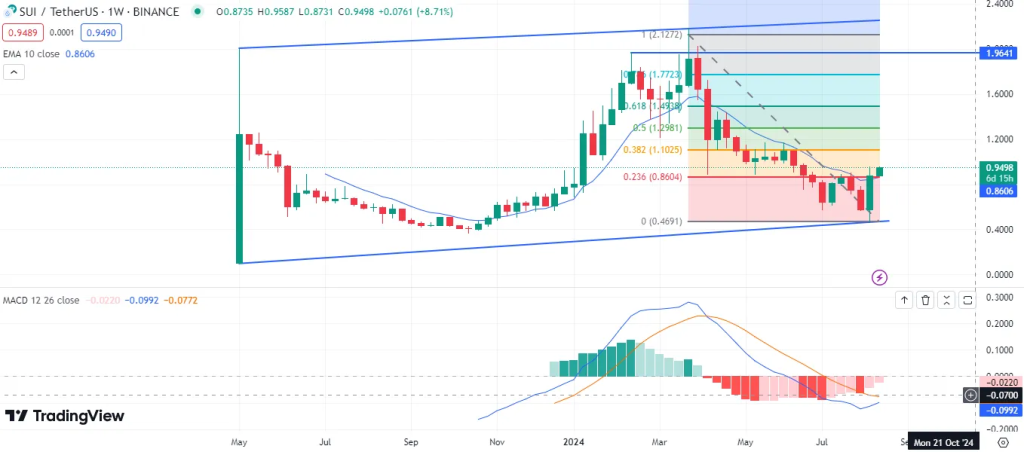
SUI is by far the best performer among top altcoins in the last 7 days. The price doubled or pumped over 100% during this period and is now trading above the $1 level.
Coin Edition posted an interesting SUI chart today when the price broke the $0.95 level.
What you'll learn 👉
Technical Analysis Insights
The trend appears to have bounced off a support level, as reported by Coin Edition earlier today. This potentially indicates the start of a bullish reversal after a downtrend. The Fibonacci retracement levels are clearly marked on the chart, with key levels identified. Currently, the price is hovering above the 0.236 Fibonacci level ($0.8604), which has acted as a support level. This bounce could be a bullish signal, with the next target potentially being the 0.382 Fibonacci level around $1.1025.
The chart shows the 10-week Exponential Moving Average (EMA) at $0.8606. With the price trading above this 10 EMA, it indicates a potential bullish trend. Historically, when the price crosses above a key EMA, it can signify the start of an upward trend.

Looking at the Moving Average Convergence Divergence (MACD) indicator, we see the MACD line crossing above the signal line, which is typically considered a bullish signal. The histogram has also shifted from negative to less negative, indicating diminishing bearish momentum and the possibility of a bullish reversal.
Of course, the main reason for the pump is the fact that Grayscale launched SUI fund last week.
Read also: Expert Recommends Accumulating Ethereum and Solana, Predicts When SOL and ETH Prices Could Peak
SUI Price Prediction
There’s a clear upward sloping channel visible on the chart, with the current price closer to the lower boundary of the channel. This suggests that while the price is currently on the lower side, there is potential room to move up toward the upper boundary, possibly aligning with the higher Fibonacci levels or previous highs.
The immediate resistance is around the 0.382 Fibonacci level at $1.1025. If the price can break through this level, it could move towards the 0.5 level at $1.2981 and then 0.618 at $1.4938. The upper boundary of the channel, near the 1 Fibonacci level at $2.1272, represents the most optimistic target if the bullish momentum sustains.
It’s worth noting that SUI pumped even more after this analysis, and the price is no longer at $0.95. As of now, it’s actually trading at $1.1, which aligns with the projected immediate resistance level.
Read also: Is Cardano Dead and Going to Zero? ADA Price Prediction
Given the bounce from the Fibonacci 0.236 level, the MACD crossover, and the price moving above the 10 EMA, there are several indicators pointing toward a bullish outlook. The key area to watch for confirmation would be the 0.382 Fibonacci level at $1.1025.
However, be careful with SUI since a lot of traders are now in profit. If the price falls back below the 10 EMA and the 0.236 Fibonacci level, it could signal a continuation of the bearish trend. Hence, the next few weeks will be crucial to confirm the trend direction.
Subscribe to our YouTube channel for daily crypto updates, market insights, and expert analysis.
We recommend eToro
Wide range of assets: cryptocurrencies alongside other investment products such as stocks and ETFs.
Copy trading: allows users to copy the trades of leading traders, for free.
User-friendly: eToro’s web-based platform and mobile app are user-friendly and easy to navigate.


