
Ali, a crypto analyst, shared an important update about Stellar (XLM). According to Ali, “Stellar $XLM could be gearing up for a bounce, as the TD Sequential indicator flashes a buy signal on the hourly chart. One to watch closely!”
The hourly candlestick chart for Stellar against Tether is showing some interesting developments. At the time of the chart, XLM was trading at approximately $0.27818, with a 1.13% increase from the previous candle.
The TD Sequential indicator has displayed a red “9” on the chart, which is typically considered a buy signal. This technical indicator is designed to identify potential trend exhaustion and reversal points. When we see a 9-count like this, it often suggests that a downward trend may be losing momentum, and we could see a bounce or reversal soon.
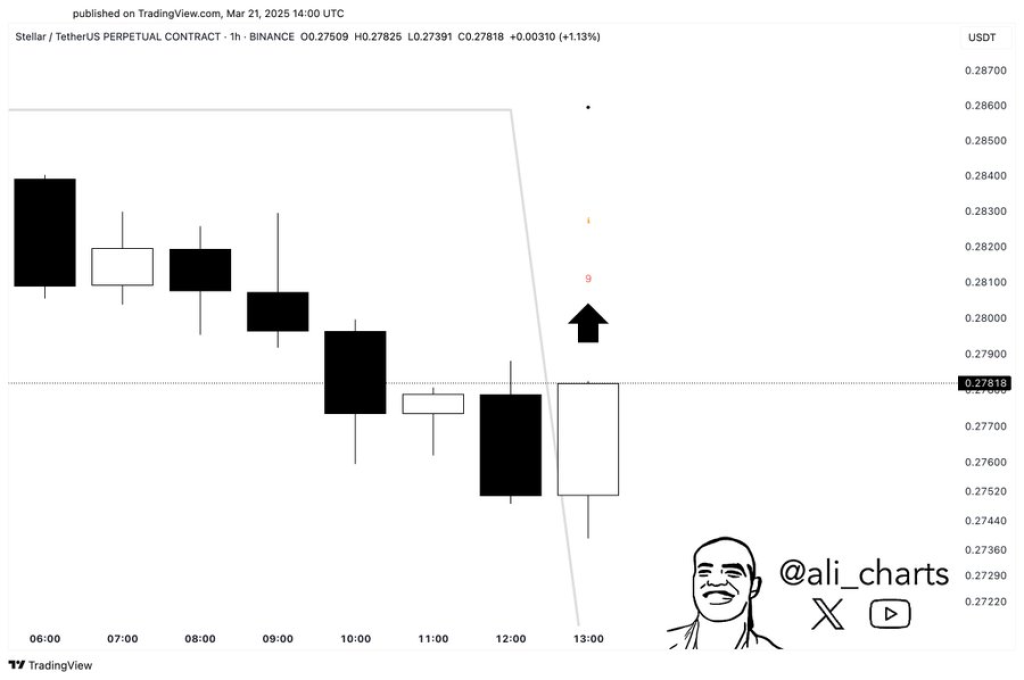
Looking at the candlestick patterns, the previous trend has been clearly bearish with consecutive black candles. However, the most recent activity shows signs of a potential reversal. We can see a large black candle, likely representing a final push downward, followed by a white bullish candle that suggests buyers are stepping in.
For traders watching support and resistance levels, the recent low around $0.2739 could serve as support. The next resistance levels to watch are near $0.2800 and above that, around $0.2830-0.2850 based on previous price action.
Daily Chart Provides Broader Context
When we zoom out to examine the daily chart, we can see XLM is in an even more interesting position. There’s a clear descending trendline connecting lower highs since the November 2024 top, when XLM reached around $0.63. This trendline has acted as resistance multiple times.
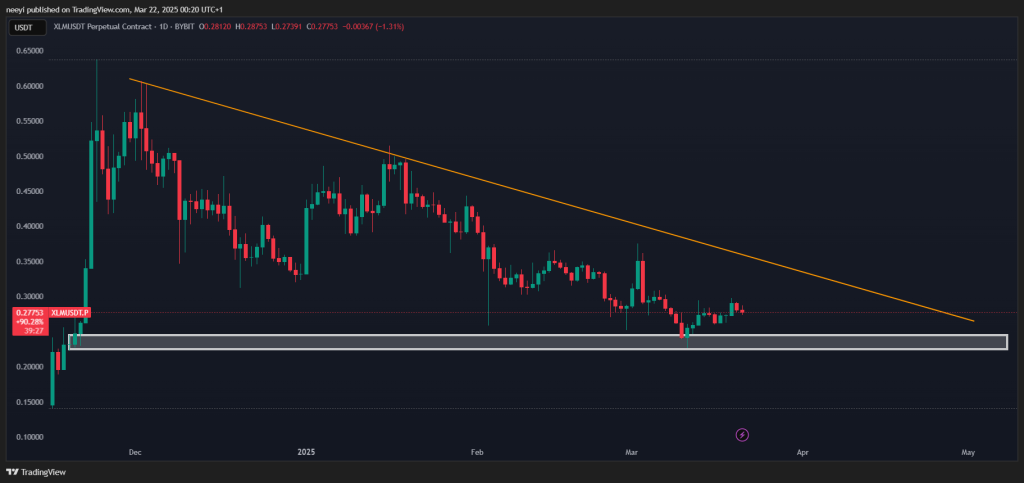
At the same time, there’s a strong horizontal support zone between approximately $0.26 and $0.275, which has been tested several times since January. Currently, the price is hovering just above this support area at around $0.277, attempting to form a base.
This situation shows that XLM is consolidating within a tightening range. It’s being pressured from above by the descending trendline while being supported from below by the horizontal demand zone. In case the price turns strongly bullish, the major price target would be the descending trendline.
Read Also: Can Ripple Really Overtake Ethereum? Analyst Weighs In on XRP Path to $100
However, traders should be aware that a breakdown below $0.26 would invalidate this support and could lead to a bearish scenario. If the price fails to bounce and breaks down from the support zone, we might see a sharp drop, possibly toward $0.24 or lower, which is the next untested support from November 2024.
Subscribe to our YouTube channel for daily crypto updates, market insights, and expert analysis.

We recommend eToro
Wide range of assets: cryptocurrencies alongside other investment products such as stocks and ETFs.
Copy trading: allows users to copy the trades of leading traders, for free.
User-friendly: eToro’s web-based platform and mobile app are user-friendly and easy to navigate.