
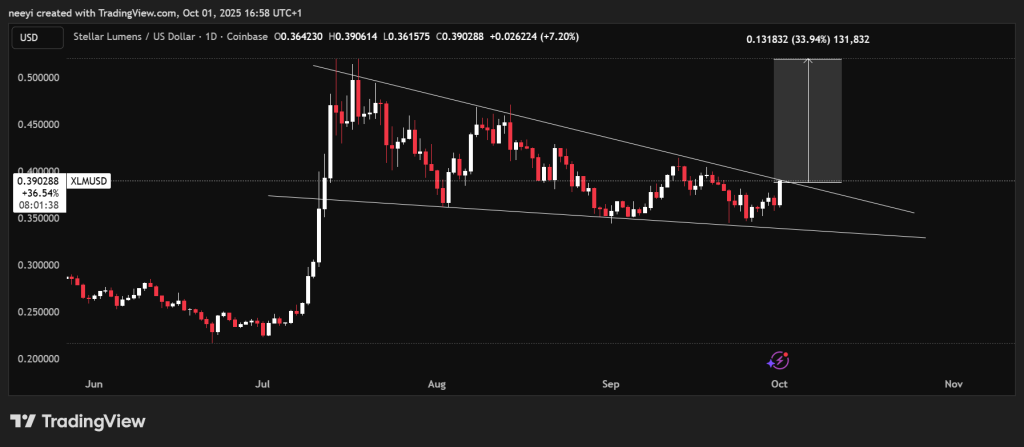
Stellar has been locked inside a descending wedge pattern since July. This pattern has been squeezing the price tighter, acting as both resistance at the top and support at the bottom. For months, XLM price has been bouncing within this narrowing range, but the space inside the wedge is now running out.
The chart shows XLM price approaching the upper boundary of the wedge around $0.39 to $0.40. A breakout from this level would be a strong signal that Stellar could be ready for its next rally. The first major target in such a breakout scenario sits near $0.52, which would represent about a 30% jump from current levels.
If resistance proves too strong, the XLM price could stay inside the wedge a bit longer. Still, with the wedge now very tight, the likelihood of a significant move soon is high.
XLM price breakout potential explained
Technical analysts often view a
as a bullish continuation pattern. This means that while the trend may look heavy in the short term, the structure often leads to an upward break. The momentum building near the top of the wedge suggests that traders are watching closely.
A breakout above $0.40 could open the path to $0.52, aligning with the measured move of about 33%. That level has acted as resistance before, so it is a natural first target if Stellar price manages to break higher.
Technical indicators for Stellar price
Beyond the chart pattern, it is helpful to check what technical indicators are saying. Readings from Investing.com show a mixed picture. Some indicators suggest neutral momentum, while others highlight possible buying strength or risk of continued weakness.
Here is the snapshot:
| Name | Value | Interpretation |
|---|---|---|
| RSI (14) | 51.882 | Neutral |
| Stochastic (9,6) | 48.293 | Neutral |
| MACD (12,26) | -0.03 | Sell |
| CCI (14) | 0.1379 | Neutral |
| ATR (14) | 0.1161 | High Volatility |
| Ultimate Oscillator | 51.207 | Buy |
| ROC | -4.543 | Sell |
The summary of these readings is neutral overall. Three indicators lean toward buy, four suggest neutral, and three signal sell. The average interpretation is that Stellar price is balanced, with no strong directional bias yet. What stands out is the ATR at 0.1161, which points to high volatility, often a sign that a big move may be on the way.
Stellar price is sitting at a key decision point. The wedge has nearly closed, meaning the breakout moment is close. If XLM price breaks above the top line near $0.40, the door opens for a run toward $0.52. That would be roughly a 30% gain and would put Stellar back on the radar of short-term traders.
Read Also: How High Can Pudgy Penguin (PENGU) Price Go in October?
Failure to break resistance would not end the story, though. XLM could still trade sideways inside the wedge a little longer before making its next move. With volatility building, however, the breakout appears to be approaching quickly.
Subscribe to our YouTube channel for daily crypto updates, market insights, and expert analysis.