Stellar (XLM) Price to Hit $0.10 Despite the Market Crash, SOL and MATIC having Trouble Keeping Up

Stellar’s native token, XLM, has been showing impressive resistance in the face of the recent market crash. Based on our technical analysis, the coin has been able to maintain a bullish stance despite the bearish market conditions.
Stellar’s XLM is trading at $0.08429, and the coin has seen a 3.94% increase in the last 24 hours – one of the biggest gainers in the top 30 coins during that period, according to data from CoinMarketCap. The real question is – can XLM hit $0.10 anytime soon?
Find High-Potential Token, yPredict, powered by its native token $PRED, is emerging as a significant player in the crypto space. The presale YPRED, which is ongoing at ypredict.ai, has already raised over $2.25 million in seed round funding from early investors. As a new low market cap coin currently on presale, it powers an AI-based tool that predicts market movements and identifies high-potential tokens. The token also offers added utility for holders, unlocking access to a suite of analytics tools, including in-depth research into the tokenomics of upcoming crypto games and NFT projects. Get in on the Ground Floor and Unlock Exclusive Analytics Tools!
Show more +Our analysis indicates that after a tough bearish candle and a trendline that could be broken in the coming days, it might be better to take a short position. This suggests that while there may be some downward pressure on the price, the overall trend remains positive.
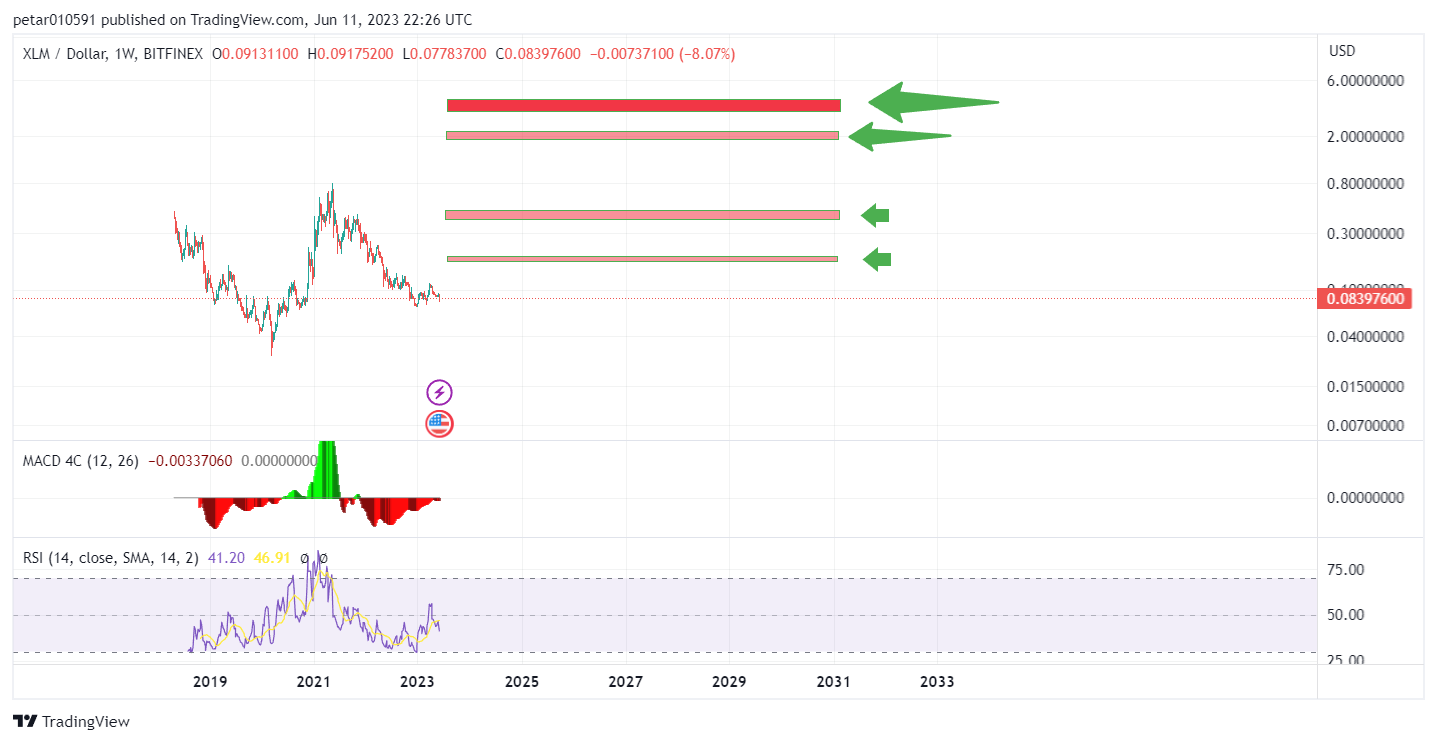
The above chart provides a medium-term view of the Stellar price. The chart shows that the price of Stellar in the weekly timeframe is suitable for investment. This suggests that despite short-term fluctuations, the long-term outlook for Stellar remains strong.
The Moving Average Convergence Divergence (MACD) and the Relative Strength Index (RSI) further support this view. The MACD line is close to crossing the signal line, indicating a potential bullish crossover, while the RSI is near the 50 mark, suggesting a balance between buying and selling pressures.
The journey toward $0.10 is not just a random number pulled from the air. It represents a significant psychological barrier for many traders and investors. Breaking this barrier could trigger a new wave of buying pressure, pushing the price even higher.
What you'll learn 👉
Solana (SOL): Oversold at Support but Remain Bearish
Our chart analysis shows a comprehensive view of Solana’s price movements. The chart indicates a bearish sentiment, with SOL showing signs of struggle.

The price broke below the $20 support level and the 200-day moving average, signaling a resumption of the downtrend. It dipped as low as $12 but bounced back to another support level of $15. However, the Relative Strength Index (RSI) is below 25, indicating that the asset is very oversold and could bounce up in the near term.
Despite this potential bounce, the overall trend remains downward, making this a higher-risk swing trade setup. The Moving Average Convergence Divergence (MACD) line is below the MACD signal line, and the RSI is below 45, both of which indicate bearish momentum.
In terms of support and resistance levels, the nearest support zone is at $15, followed by $11. The nearest resistance zone is at $20, which was a previous support level, followed by $25 – $30.
While SOL has shown some resilience in the face of the market crash, the technical indicators suggest that it may face significant challenges in the near future.
Polygon (MATIC) Under Selling Pressure
Our Polygon price analysis revelas clear falling wedge formation in the daily timeframe. This pattern is typically considered a bullish signal, suggesting a potential price reversal.
However, the fact that MATIC is currently based on the $0.75 support level indicates that the coin is under significant selling pressure. If MATIC is rejected from this support level, it could break the falling wedge, leading to further price decline.

Once the wedge is broken upwards, the first target would be $1.19, and the main target would be $1.60. However, given the current market conditions, it seems unlikely that MATIC will break the wedge upwards in the near future.
MATIC is currently facing significant challenges. Despite its potential, the current market conditions and their technical indicators suggest that its price may continue to decline in the short term.
Conclusion
In the tumultuous world of cryptocurrencies, the recent market crash has put many coins to the test. Stellar’s native token, XLM, has emerged as a beacon of resilience, maintaining a bullish stance amidst the bearish market conditions.
While XLM shows promising resilience, both SOL and MATIC are grappling with bearish market conditions. As always, investors are advised to keep a close eye on these coins and consider their risk tolerance before making investment decisions.